Figure 7.
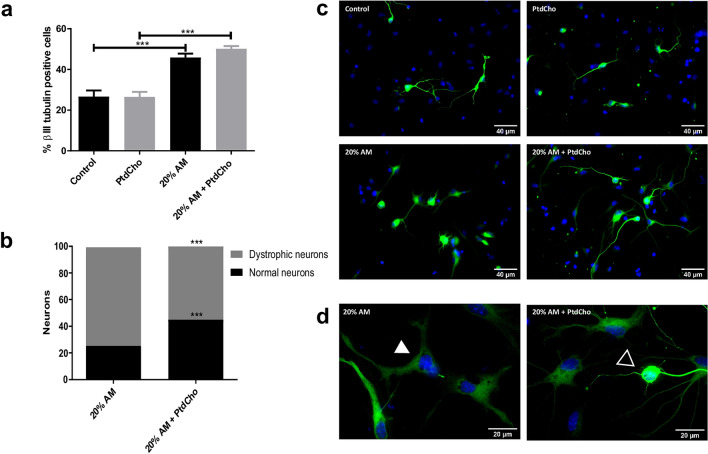
PtdCho restores morphology of dystrophic neurons. (a) Percentage of βIII-tubulin positive cells analysed by immunocytochemistry coupled to fluorescence microscopy of NSCs exposed to 20% V/V of AM when PtdCho was added later on, after 1 day of culture, and incubated for 3 days. Graph represents the percentage of neuronal differentiation measured in three independent experiments. Data were presented as mean ± SEM. ***p < 0.001. (b) Percentage of normal neurons (black bars) and dystrophic neurons (grey bars) after 3 days in culture under the indicated conditions. ***p < 0.001 (Student’s T-test). (c) Representative images (× 40) of neurons incubated under the indicated conditions Scale bars: 40 μm. (d) Representative images of neurons morphology under the indicated condition (× 100). Open arrow indicates normal neuron and white arrow indicates dystrophic neuron. Scale bars: 20 μm.

