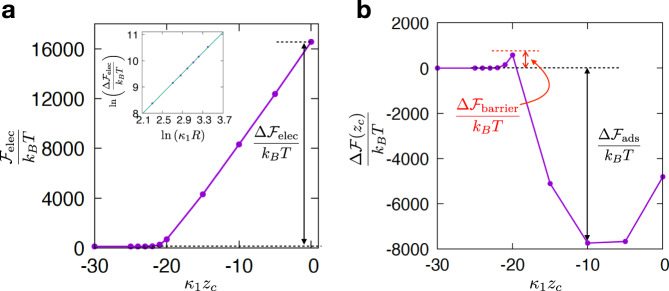
Fig. 2. Free energy for an RNA virus approaching an air-water interface.
a Approach curve showing the increase in electrostatic free energy as a function of distance to the air-water interface. Parameters are as specified in the text. Inset: scaling of the electrostatic free energy increase in units of kBT as a function of dimensionless radius of the virion, κ1R. The line is a fit, and has slope ~1.95, which is close to the predicted value of 2, see Supplementary Note 3. b Plot of the total (electrostatic plus Pickering) free energy change, , as a virion approaches an air-water interface (γ = 70 mN/m). The electrostatic free energy barrier and the adsorption free energy gain are shown in the plot.

