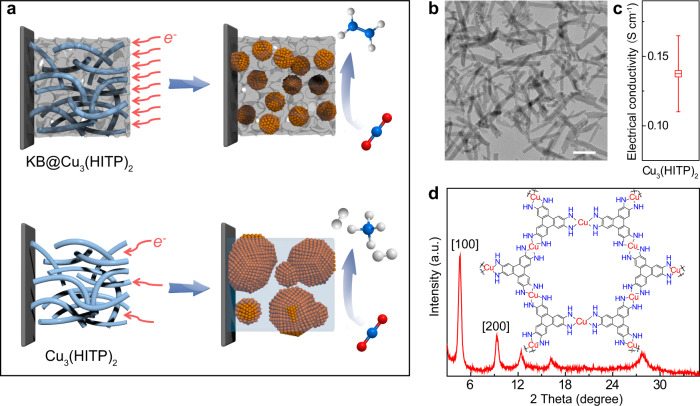
Fig. 1. Schematic representation and structure characterization.
a Schematic diagrams showing the modulation of CO2RR product selectivity by Cu3(HITP)2-derived Cu0 entities in the presence (top) or absence (bottom) of carbon support. b TEM image, c electrical conductivity measured by the four-probe method, and d XRD pattern of the as-synthesized Cu3(HITP)2. The scale bar in b is 200 nm. Error bars represent the standard deviation of three independent measurements.

