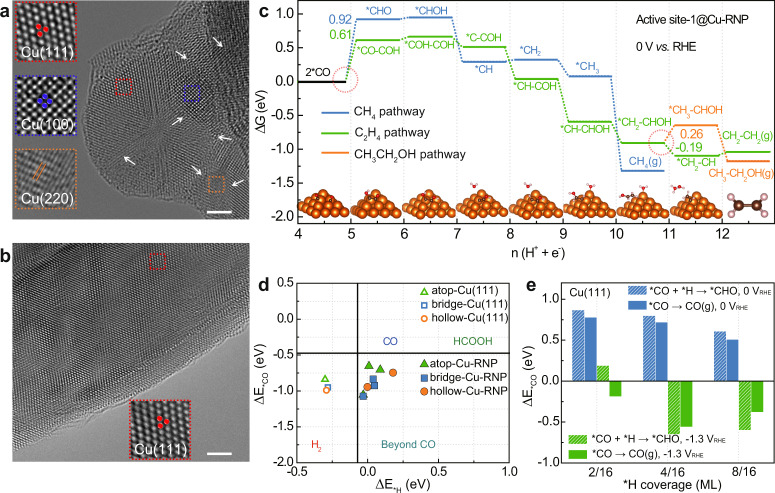
Fig. 5. CS-TEM images and DFT simulation.
TEM images of a KB@Cu3(HITP)2 and b Cu3(HITP)2 after CO2RR conducted at −1.25 V for 10 h in CO2-saturated 0.1 M KHCO3 electrolyte. c Reaction pathways starting with 2 *CO identified on active site-1 of [101] Cu rectangular nanopyramid (Cu-RNP) surface to model the post-electrolytic KB@Cu3(HITP)2 at 0 V. Insets are the atomic structures of intermediates along the C2H4 pathway. The key bifurcating points are highlighted with red circles and the unit of energy is eV. d Relation between ΔE*CO and ΔE*H at various sites on the Cu-RNP and Cu (111) surfaces. Vertical and horizontal black lines represent the equilibrium potential for *H ↔ ½ H2 and *CO ↔ CO, respectively and e the energetics of reactions *CO + *H → *CHO and *CO → CO (g) on the modeled post-electrolytic Cu3(HITP)2 surface of Cu (111) under various *H coverages and bias potentials. The scale bars in a, b are 2 nm.

