Figure 1.
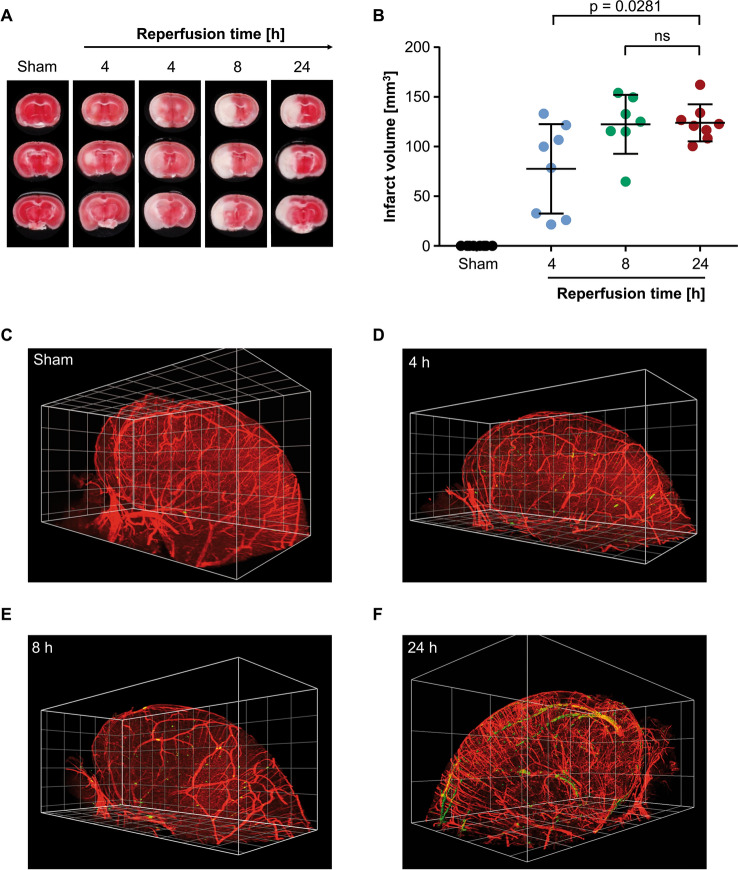
Cerebral thrombus formation occurs after development of infarcts following tMCAO. (A) Representative images of brain sections stained with TTC to visualize infarcts. Each timepoint shows three consecutive brain sections from one mouse. White: Infarct, Red: viable tissue. (B) Edema corrected quantification of infarct sizes. Data is plotted using GraphPad Prism 7.05 (https://www.graphpad.com) depicted as mean ± SD and each dot represents one mouse. N = 7–8 per time point. (C–F) 3D reconstruction of the ipsilateral hemispheres of mice after (C) sham surgery, (D) 4 h of reperfusion, (E) 8 h of reperfusion or (F) 24 h of reperfusion. Vessels (CD105/CD31; red), platelets (GPIX; green). 3D reconstructions were generated using Biptlane Imaris 9.6 (https://imaris.oxinst.com/); grid size: 0.5 mm. Statistical differences were analyzed using two-tailed Mann–Whitney U test. P-values < 0.05 were considered statistically significant. Compared to sham, differences to all other groups are highly significant with P < 0.001.

