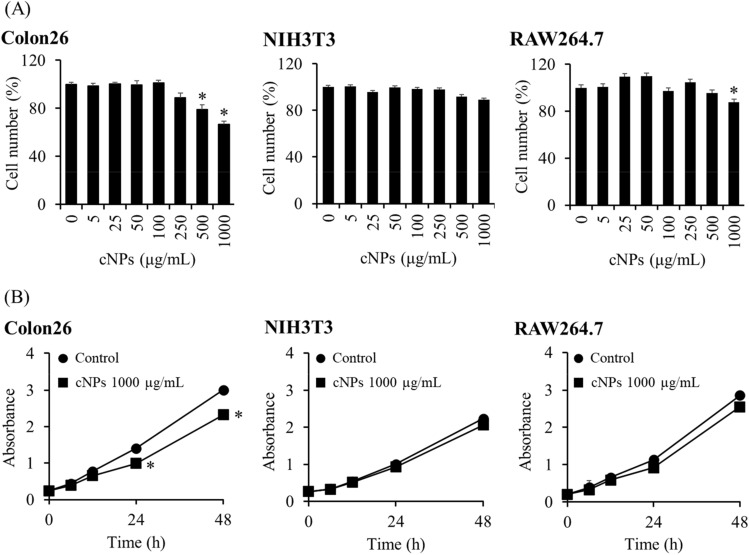
Figure 3.
Cell number and proliferation after incubation with cNPs. (A) Cell number was measured by Cell Counting Kit-8 (CCK8) assay after 24 h of cNP addition. Colon26, NIH3T3, and RAW264.7 cells were incubated with 5–1000 μg/mL of cNPs. Results are expressed as the mean ± SD of four samples. *p < 0.05 vs. 0 μg/mL cNP group (the control group). (B) Cell proliferation was measured by CCK8 assay after 6, 12, 24 and 48 h of 1000 μg/mL cNP addition. Results are expressed as the mean ± SD of four samples. *p < 0.05 vs. control group.

