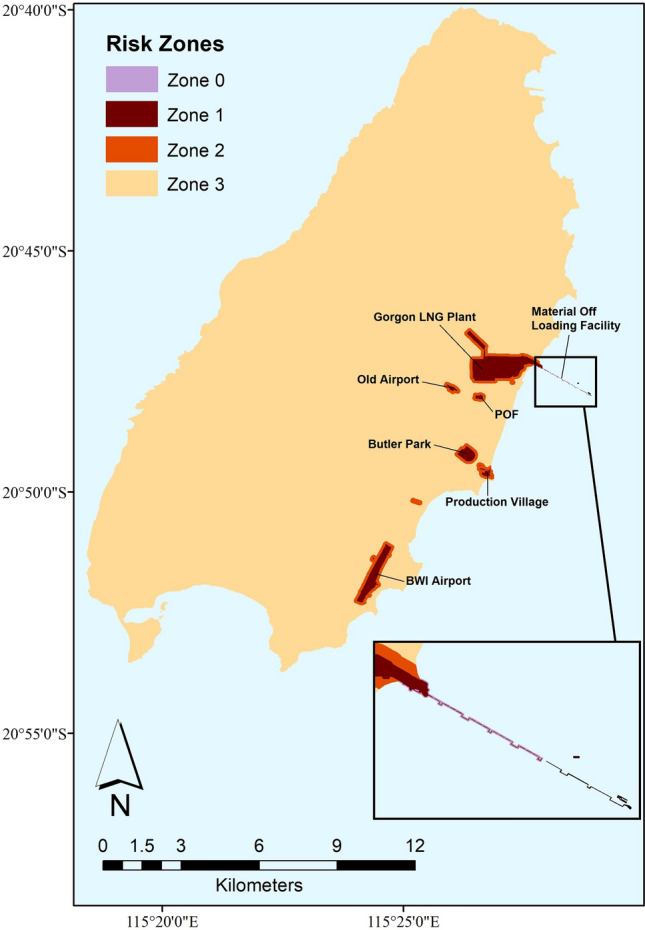
Figure 1.

Quarantine invasion risk map of the Asian House Gecko (AHG) on Barrow Island. Invasion risk was calculated by multiplying relative importance weights (RIWs) for entry points (see Table S1) and RIWs for establishment (see Table S2), and categorized into four ranges for mapping as described by Jarrad et al.30. 100 m was added around all entry points as the buffering to indicate the potential home range of AHG. The risk map was generated using the sf (1.0.1), ggmap (3.0.0), and ggplot2 (3.3.3) packages in R (version number 4.0.4, URL https://www.R-project.org) from shapefiles provided by Chevron. Zone 1 is the area with the highest occupancy probability, where the majority of the surveillance budget should be spent. This zone consists of areas where high risk activities for incursion are undertaken. These activities include the unloading of cargo (laydown areas), the receipt of planes (airports) and marine vessels (marine ports). Zone 2 is the secondary introduction area (100 m buffer area around Zone 1) and is considered the lower risk boundary for a species dispersing out of Zone 1. Zone 0 is the buffer area at Material Offloading Facility (MOF) (i.e. X-Blocs area). This is because the habitat at Zone 2 at the MOF is highly different to that at all other locations, making the characters of Surveillance System Components (SSCs) in Zone 2 at the MOF (i.e. X-Blocs) different from that in Zone 2 at other locations. Zone 3 is the remaining island area where the AHG is less likely to establish prior to detection thus with no SSCs allocated.
