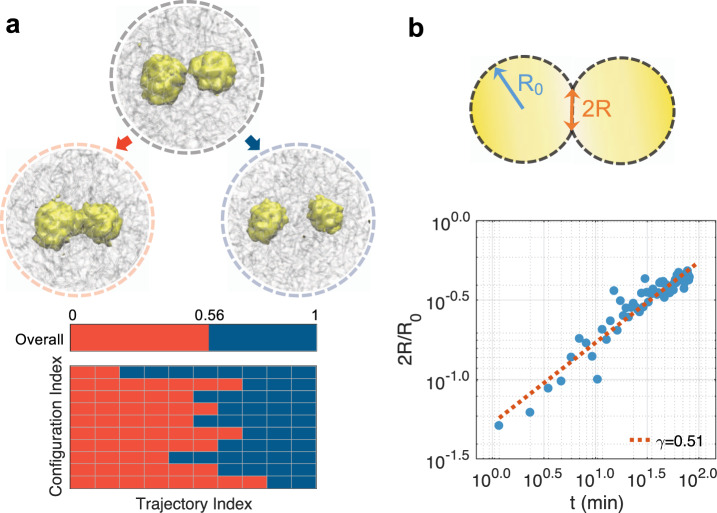
Fig. 4. Dynamical characterization of droplet coalescence.
a Trajectories initialized from transition state configurations share approximately equal probability of committing to the two and single droplet state. The number of trajectories that ended up in the single droplet state is shown as red blocks in the bottom panel. Example configurations of the single-droplet (left), transition (middle), and two-droplet (right) state are shown on top. b Time evolution of the radius of the neck region between two droplets averaged over twelve independent simulations.

