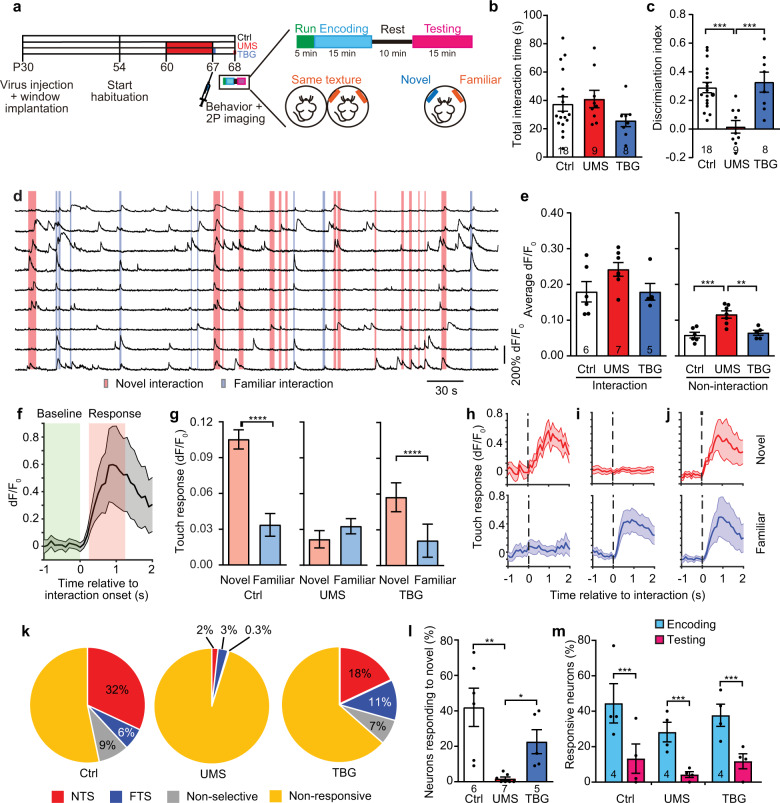
Fig. 5. Ca activity of S1BF L2/3 neurons during texture interaction was altered by UMS and rescued by TBG.
a Schematic of experimental design. b Total interaction time during testing (F(2,32) = 1.487, p = 0.2412, one-way ANOVA). c Discrimination index during testing (F(2,32) = 10.95, p < 0.001, one-way ANOVA with post hoc Tukey’s multiple comparisons test). d Examples of neuronal Ca traces from a control mouse. Shades: interaction with textures. e Average dF/F0 over the neuronal population during texture interaction (left; H(3) = 3.792, p = 0.1538, Kruskal–Wallis test) and non-interaction periods (right; F(2,15) = 13.47, p < 0.001, one-way ANOVA with post hoc Tukey’s multiple comparisons test). f Average Ca activity of an example neuron during texture interaction. Gray shades: s.e.m. g Average touch responses to novel or familiar texture. n = 244, 293, and 221 neurons for Ctrl, UMS, and TBG, respectively. Ctrl W = −17091, p < 1 × 10⁻⁴, UMS W = 2894, p = 0.3140, TBG W = −7787, p < 1 × 10⁻⁴; Wilcoxon signed-rank test for all. Examples of neurons responding to novel (h), familiar (i), or both (j) textures, shown as Ca activities aligned to interaction onset. Shades: s.e.m. k Categories of neurons based on the ROC analysis. l Percentages of neurons responding to the novel texture (H(3) = 13.03, p < 1 × 10⁻⁴, Kruskal–Wallis test with post hoc Dunn’s multiple comparisons test). m Percentages of neurons responding to the same texture presented during encoding and testing (two-way repeated measures ANOVA, effect of treatment: F(2,9) = 0.9776, p = 0.4129; effect of WTD phase: F(1,9) = 122.1, p < 1 × 10⁻⁴, post hoc Sidak multiple comparisons test).

