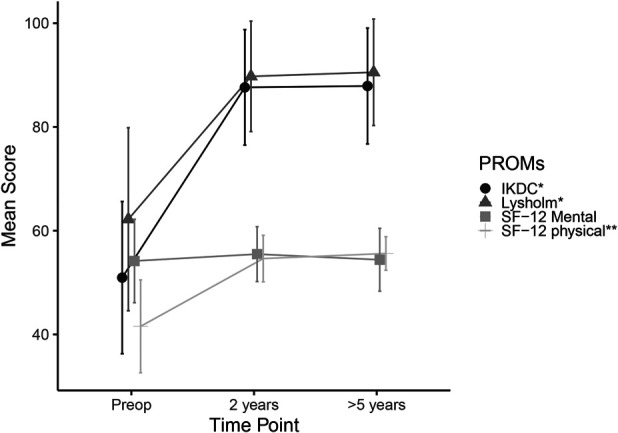
Fig. 1.

Change in mean IKDC, Lysholm scale, SF-12 MCS, and SF-12 PCS scores over time. Error bars represent 1 standard deviation. Asterisks indicate significance as follows: *baseline to 2-year (p < 0.001) and baseline to final follow-up (p < 0.0001); **baseline to 2-year (p < 0.001), baseline to final follow-up (p < 0.0001), and 2-year to final follow-up (p < 0.05). The Wilcoxon matched-pair signed-rank test was used for comparison between the follow-up periods.
