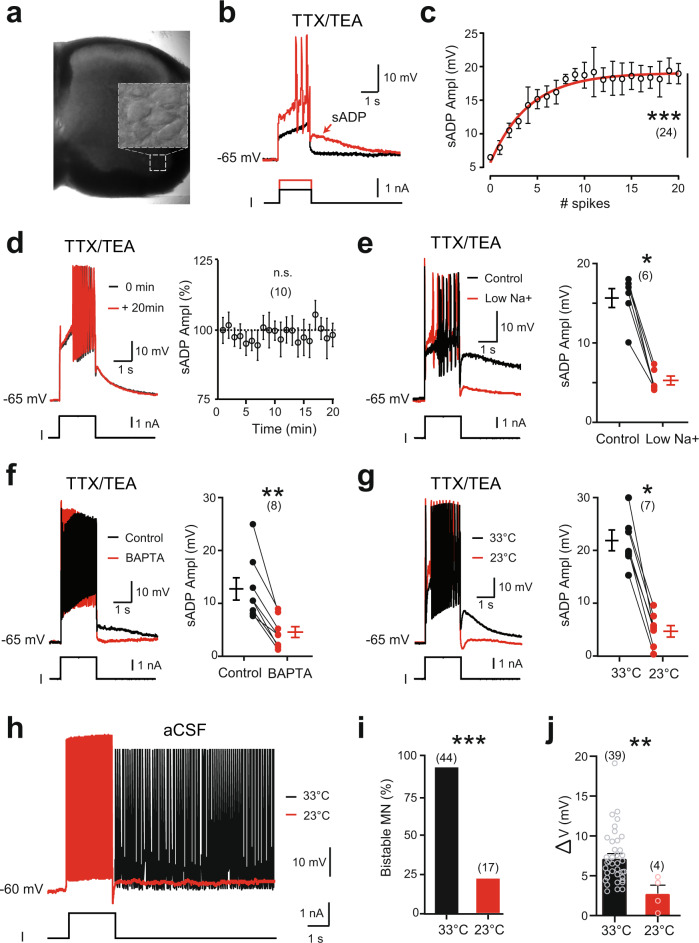
Fig. 1. Functional characterization of the thermosensitive sADP in large lumbar motoneurons from mice.
a Acute spinal cord slice from the lumbar enlargement (L4) under infrared-differential interference contrast (IR-DIC) imaged at ×4 magnification. Inset: high magnification (×40) of a motoneuronal pool readily observable in the ventral horn and patch-clamped under IR-DIC. b Superimposition of voltage traces from a motoneuron recorded under TTX and TEA in response to subthreshold (black) or suprathreshold (red) depolarizing pulses. The arrow indicates the slow after depolarization (sADP). c Relationship between the peak amplitude of the sADP and the number of spikes emerging during a 2-s depolarizing current pulse. Continuous red line is the best-fit nonlinear regression (n = 9 mice). d Mean time-course changes in peak amplitude of the sADP. Values are relative to the amplitude of the first sADP (n = 3 mice). e–g Left: superimposition of voltage traces from motoneurons recorded under TTX and TEA, before and after removing [Na+]o (n = 3 mice) (e), chelating intracellular Ca2+ with BAPTA (10 mM) (n = 2 mice) (f), or decreasing temperature (n = 3 mice) (g), right: mean amplitude of the peak sADP. Each circle represents an individual motoneuron. h Superimposition of voltage traces recorded in normal aCSF (i.e., without TTX and TEA) in response to a 2-s depolarizing pulse before and after reducing the temperature of the bath from 33 to 23 °C. i, j Group mean quantification of the proportion of bistable motoneurons (i) and of the bistability range ΔV (j) as a function of temperature (n = 13 mice). Numbers in brackets indicate the numbers of recorded motoneurons. n.s., no significance; *P < 0.05; **P < 0.01; ***P < 0.001 (one-way ANOVA with multiple comparisons for c, d; two-tailed Wilcoxon paired test for e–g; two-tailed Fisher test for i; two-tailed Mann–Whitney test for j). Mean ± SEM. For detailed P values, see Source data. Source data are provided as a Source data file. See also Supplementary Fig. 1.

