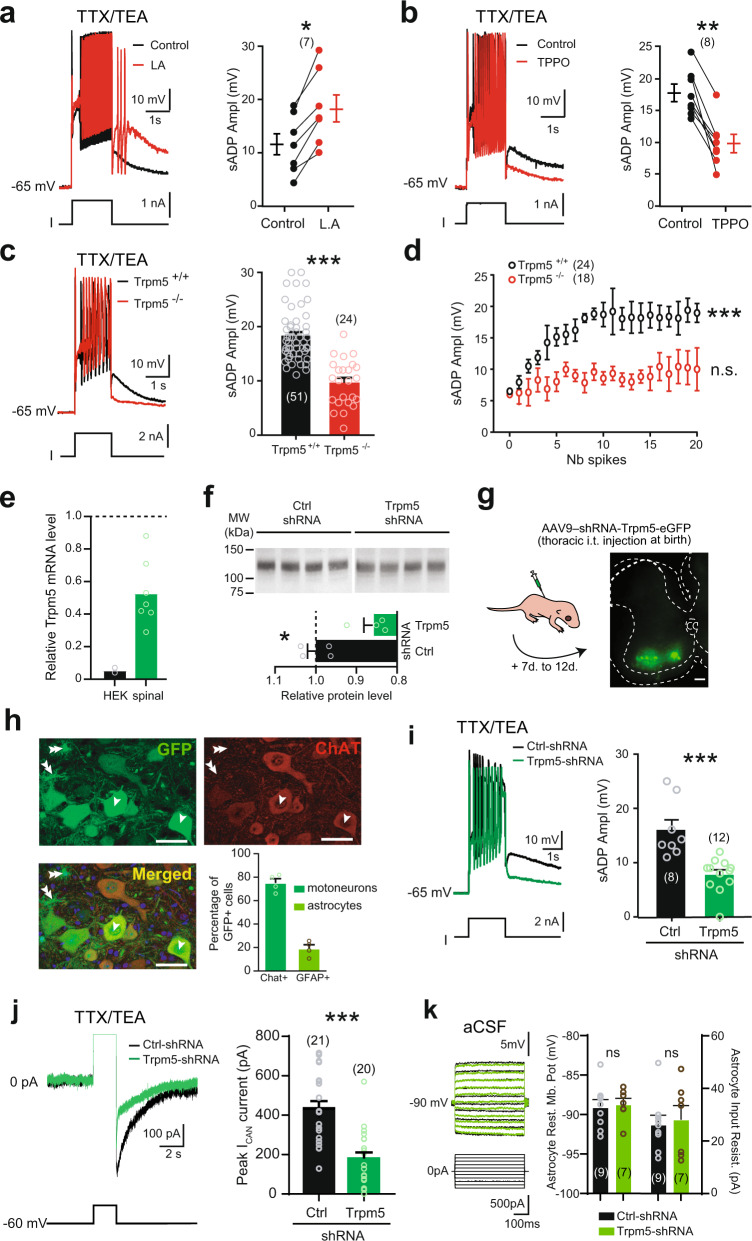
Fig. 2. The thermosensitive ICaN-mediated sADP is driven by Trpm5 channels.
a–c Left: superimposition of voltage traces in motoneurons recorded under TTX/TEA from wild-type mice in response to a depolarizing pulse before and after bath-applying linoleic acid (a, L.A., 50 µM, n = 3 mice) or triphenylphosphine oxide (b, TPPO, 50 µM, n = 4 mice), or recorded in motoneurons from Trpm5−/− mice (n = 5 mice) (c), right: mean amplitude of the peak sADP. The numbers in brackets indicate the numbers of recorded motoneurons. Each circle represents an individual motoneuron. d Relationship between the peak amplitude of the sADP and the number of spikes emerging during a 2-s depolarizing current pulse in control (black, n = 9 mice) vs Trpm5−/− mice (red, n = 5 mice). e qRT-PCR analysis assessing the efficiency of the shRNA to knockdown Trpm5 mRNA in HEK-293 cell cultures (n = 2) and spinal cords (n = 7) from ~P12 mice. The expression level of the Trpm5 mRNA in cell cultures or spinal cords was normalized to scramble shRNA values with GAPDH or ACTB as internal references, respectively. Each circle represents the mean value from one cell culture or one spinal cord. f Up: Trpm5 immunoblots of lumbar segments from P12 mice intrathecally injected at birth with an adeno-associated virus (AAV9) encoding either a scramble shRNA (n = 4 mice) or a Trpm5-targeting shRNA (n = 4 mice). One mice per lane. Bottom: group mean quantification of the ~130 kDa band normalized to scramble-injected controls. g Left: schematic representation of the experimental design, right: acquisition of a transverse spinal slice (L4) from a P10 mouse intrathecally injected at birth with an AAV9 encoding Trpm5-targeting shRNA and eGFP. Scale bar = 100 μm. The experiment was repeated four independent times with similar results. h High magnification of the ventral horn showing native fluorescence of motoneurons (single arrow) transduced by AAV9 (upper left) and immunostained for choline acetyltransferase (upper right, ChAT antibody; bottom left, merged images). Some astrocytes (double arrow) were also GFP+. Histograms (bottom right): group mean quantification of the proportion of 299 motoneurons (green) and 640 astrocytes (orange) from 4 mice transfected by AAV9-shRNA-Trpm5-eGFP. Each circle represents one mouse. Scale bar = 50 μm. i, j Left: superimposition of voltage (i) or current (j) traces from GFP+ motoneurons recorded under TTX/TEA and transduced either with scramble shRNA (black, n = 6 mice) or with a Trpm5-targeting shRNA (green, n = 5 mice), right: mean amplitude of the peak sADP (i) and the peak amplitude of the ICAN current (j). k Left: superimposition of voltage traces from GFP+ astrocytes recorded in normal aCSF and transduced either with scramble shRNA (black, n = 3 mice) or with a Trpm5-targeting shRNA (green, n = 3 mice), right: mean amplitude of the astrocytic resting membrane potential (left) and the input resistance (right). The numbers in brackets indicate the numbers of recorded cells. Each circle represents an individual motoneuron or astrocyte. *P < 0.05; **P < 0.01; ***P < 0.001 (two-tailed Wilcoxon paired test for a, b; two-tailed Mann–Whitney test for c, f, i–k; one-way ANOVA with multiple comparisons for d). Mean ± SEM. For detailed P values, see Source data. Source data are provided as a Source data file. See also Supplementary Figs. 2–4.

