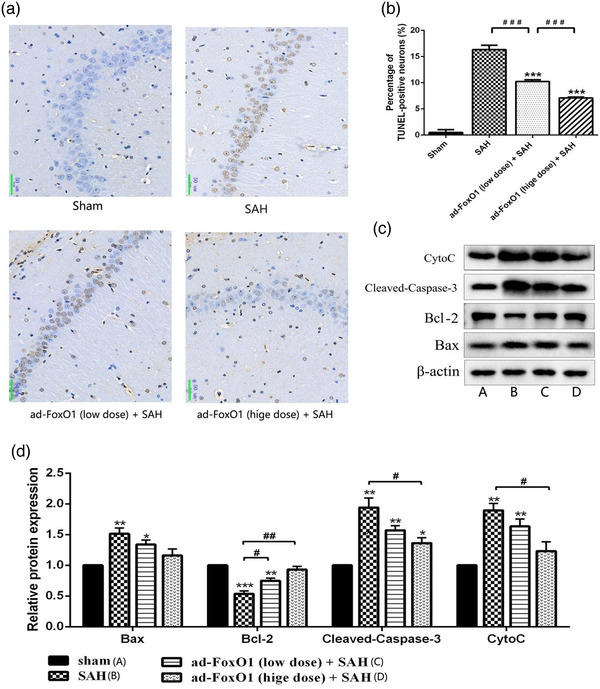
FIGURE 3.

Effects of ad‐FoxO1 on neural apoptosis in SAH rats. (a) Representative images of hippocampus following TUNEL staining, TUNEL‐positive cells were stained brown (400×). (b) Represents the change of neuronal apoptosis rate in each group. (c) Apoptosis‐related proteins were examined by western blotting assay. (d) The relative intensity of apoptosis‐related proteins was shown as a bar graph. n = 6 in each group, *p < .05, **p < .01, ***p < .001, vs. sham group. # p < .05, ## p < .01
