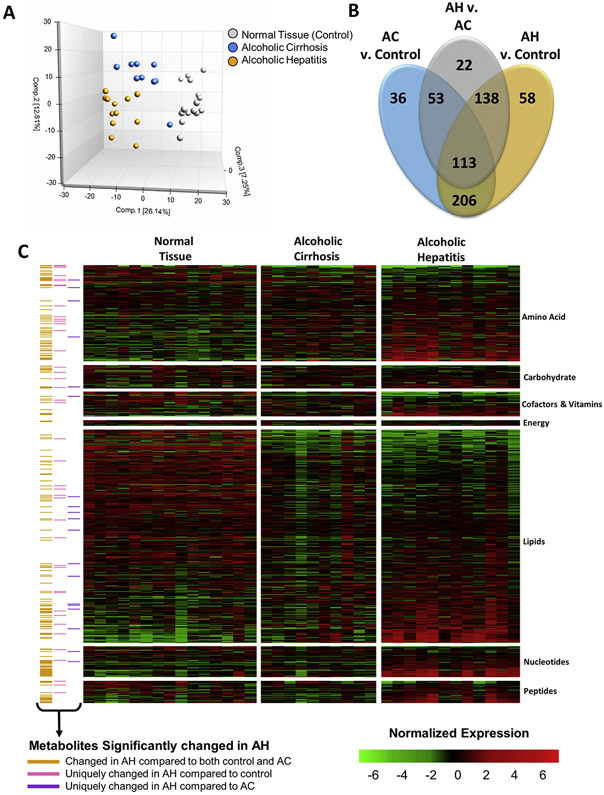
Figure 2.
The hepatic metabolome is altered in patients with AH. Metabolomics was performed at Metabolon, Inc, as described in the Materials and Methods section. (A) Plot of the Principal Component Analysis of the hepatic metabolome of normal liver tissue (control), AC, and AH. (B) Venn diagram representing the metabolites found to be significantly changed by multiple comparison testing between AH and control, between AC and control, and between AH and AC. (C) Heatmap showing the normalized expression of all metabolites detected by metabolomics analysis of the liver tissue. Annotation indicates which metabolites were significantly changed in patients with AH compared to either control individuals or patients with AC (yellow), only significantly changed in patients with AH compared to control individuals (gray), and only significantly changed in patients with AH compared to patients with AC (blue).

