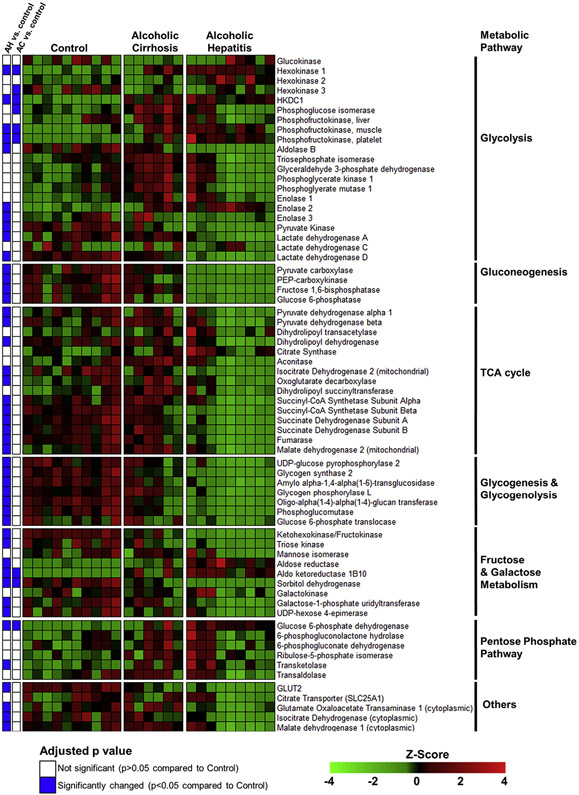
Figure 3.
Heatmap showing normalized mRNA expression levels of enzymes involved in intermediate metabolism. RNA-seq of human liver tissue was performed as described in the Materials and Methods section. A subset of genes involved in intermediate metabolism pathways is shown. The color scale represents sample Z-score. Statistical significance was determined by using the DESeq2 package and was adjusted for multiple comparisons. Statistical significance is reported as adjusted P values compared to control.

