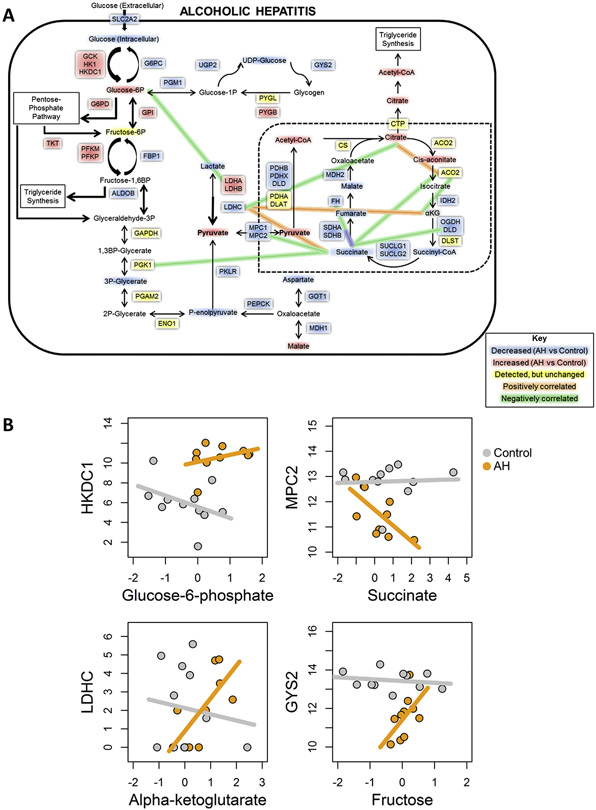
Figure 4.
Integrated analysis of metabolomics and RNA-seq. (A) Metabolic map showing significant changes in gene expresses (boxes) and intermediates (text) of glucose metabolism in patients with AH compared to normal control samples. (B) Representative plots showing correlations between genes and metabolites for control (gray) and AH (orange) samples.

