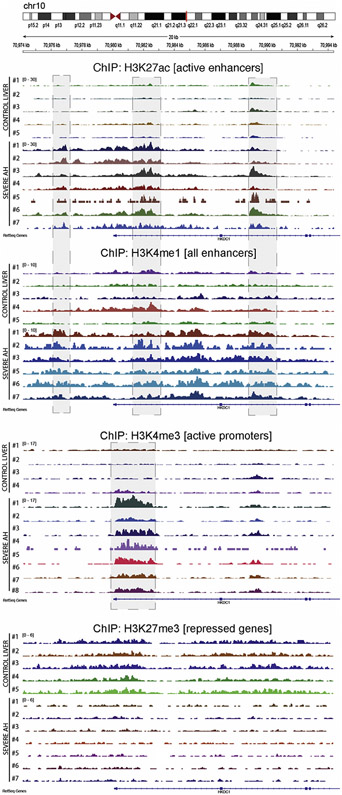
Figure 6.
Genomic view of histone ChIP-seq data showing increased activity in HKDC1 regulatory regions. Data from ChIP-seq in livers from patients with AH (n = 7) and normal livers (n = 5) is presented in the genomic context of the HKDC1 gene. H3K27ac and H3K4me1 were used to mark the activity and location of enhancers, respectively. H3K4me3 was used to verify the activity of the promoter. The H3K27me3 mark indicates the presence of gene silencing. Shadow squares indicate the detected peaks by MACS2.

