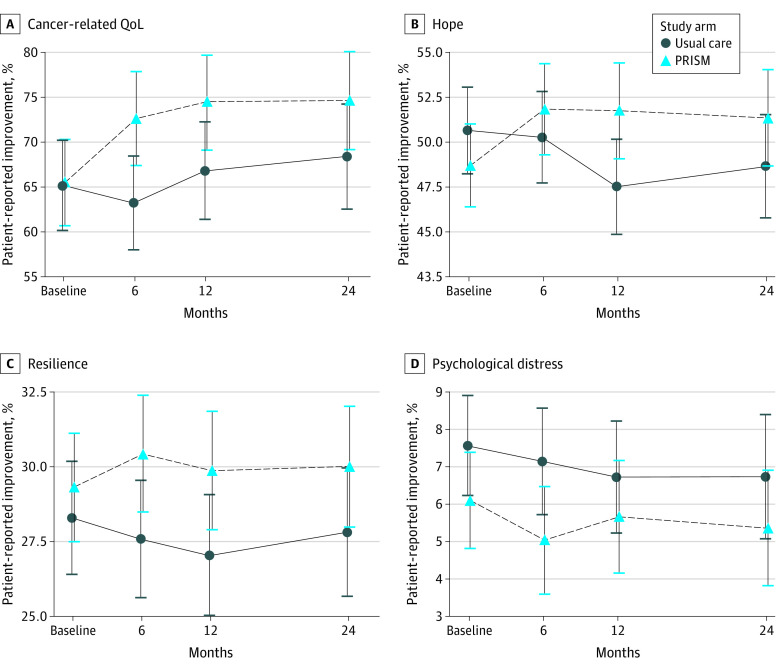
Figure 2. Trajectories of Patient-Reported Outcomes Among Patients Who Were Alive at 24 Months.
Points represent mean scores and error bars 95% CI at each time point of baseline (enrollment), 6, 12, and 24 months thereafter. PRISM indicates Promoting Resilience in Stress Management intervention; QoL, quality of life.

