
Figure. Adjusted Hazard Ratios (aHRs) for Stroke According to L-α Glycerylphosphorylcholine (α-GPC) Duration of Prescriptions.
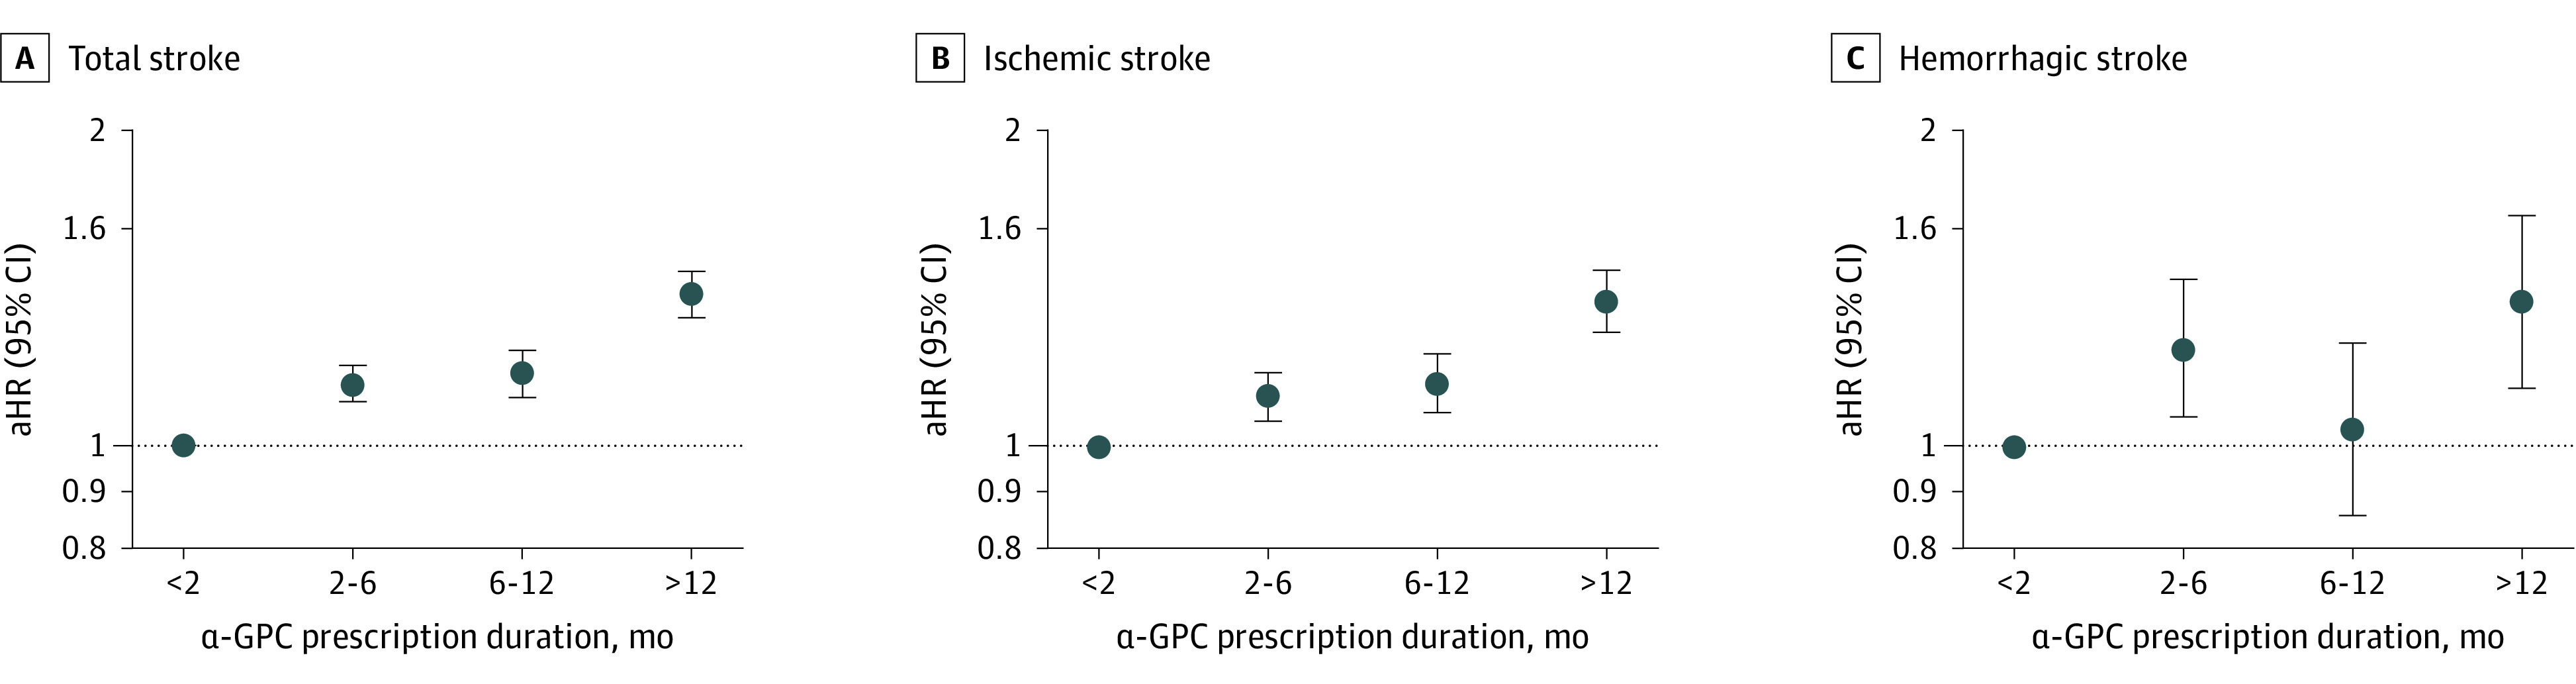
A, Total stroke (P < .001). B, Ischemic stroke (P < .001). C, Hemorrhagic stroke (P = .002). The aHRs were calculated by Cox proportional hazards regression after adjustments for age, sex, household income, and Charlson Comorbidity Index score. Error bars indicate 95% CIs; dashed lines, reference values of 1.0.