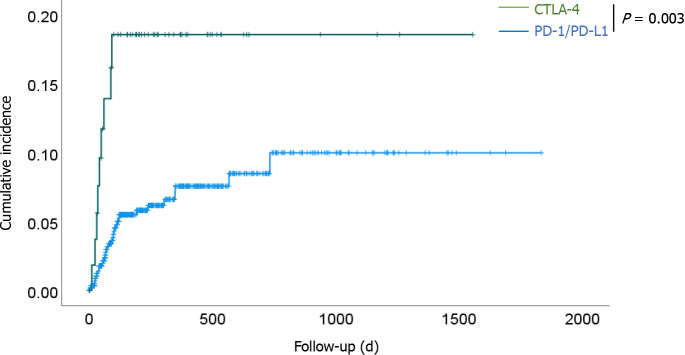
Figure 1.
Kaplan–Meier curves of the cumulative incidence of gastrointestinal- immune-related adverse events for all patients in the programmed cell death-1/programmed death-ligand 1 and cytotoxic T-lymphocyte antigen 4 groups. The cumulative incidence was significantly higher in the cytotoxic T-lymphocyte antigen 4 group than in the programmed cell death-1/programmed death-ligand 1 group (P = 0.003). CTLA-4: Cytotoxic T-lymphocyte antigen 4; PD-1: Programmed cell death-1; PD-L1: Programmed death-ligand 1.

