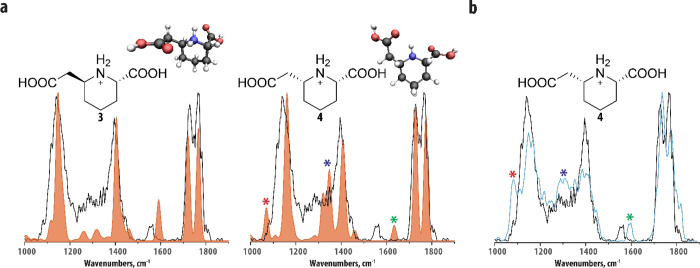
Figure 3.
Molecular identification of feature C and D using computational modeling and IRIS. (a) Experimental IR spectrum of the co-eluting features C and D (black trace in both panels) in comparison to the theoretical IR spectra of structures 3 and 4 (left and right panel, orange trace). Input structures for the computations and the conformations resulting from the quantum-chemical calculations are inlaid in each panel. Colored stars indicate bands that are particularly diagnostic for structure 4; see text. (b) Comparison of the experimental IR spectra of the co-eluting features C and D (black trace) and protonated 4 (blue trace). The molecular structure of the protonated reference standard is inlaid in the panel.

