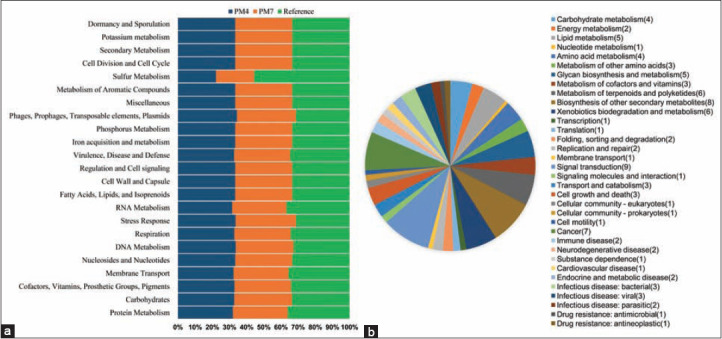
Figure-6.

Metabolic pathway reconstruction and subsystem distribution. (a) Comparative gene distribution to different metabolic pathways of PM4, PM7, and the closely related Razi_Pm0001 genomes as predicted by Rapid Annotation System Technology Server. (b) The genes classified into 34 categories, and 356 subsystems. The pie chart and count of the subsystem features in the right panel demonstrate the percentage distribution and category of the subsystems found in all the three strains PM4, PM7, and Razi_Pm0001, predicted using KEGG pathway analysis.
