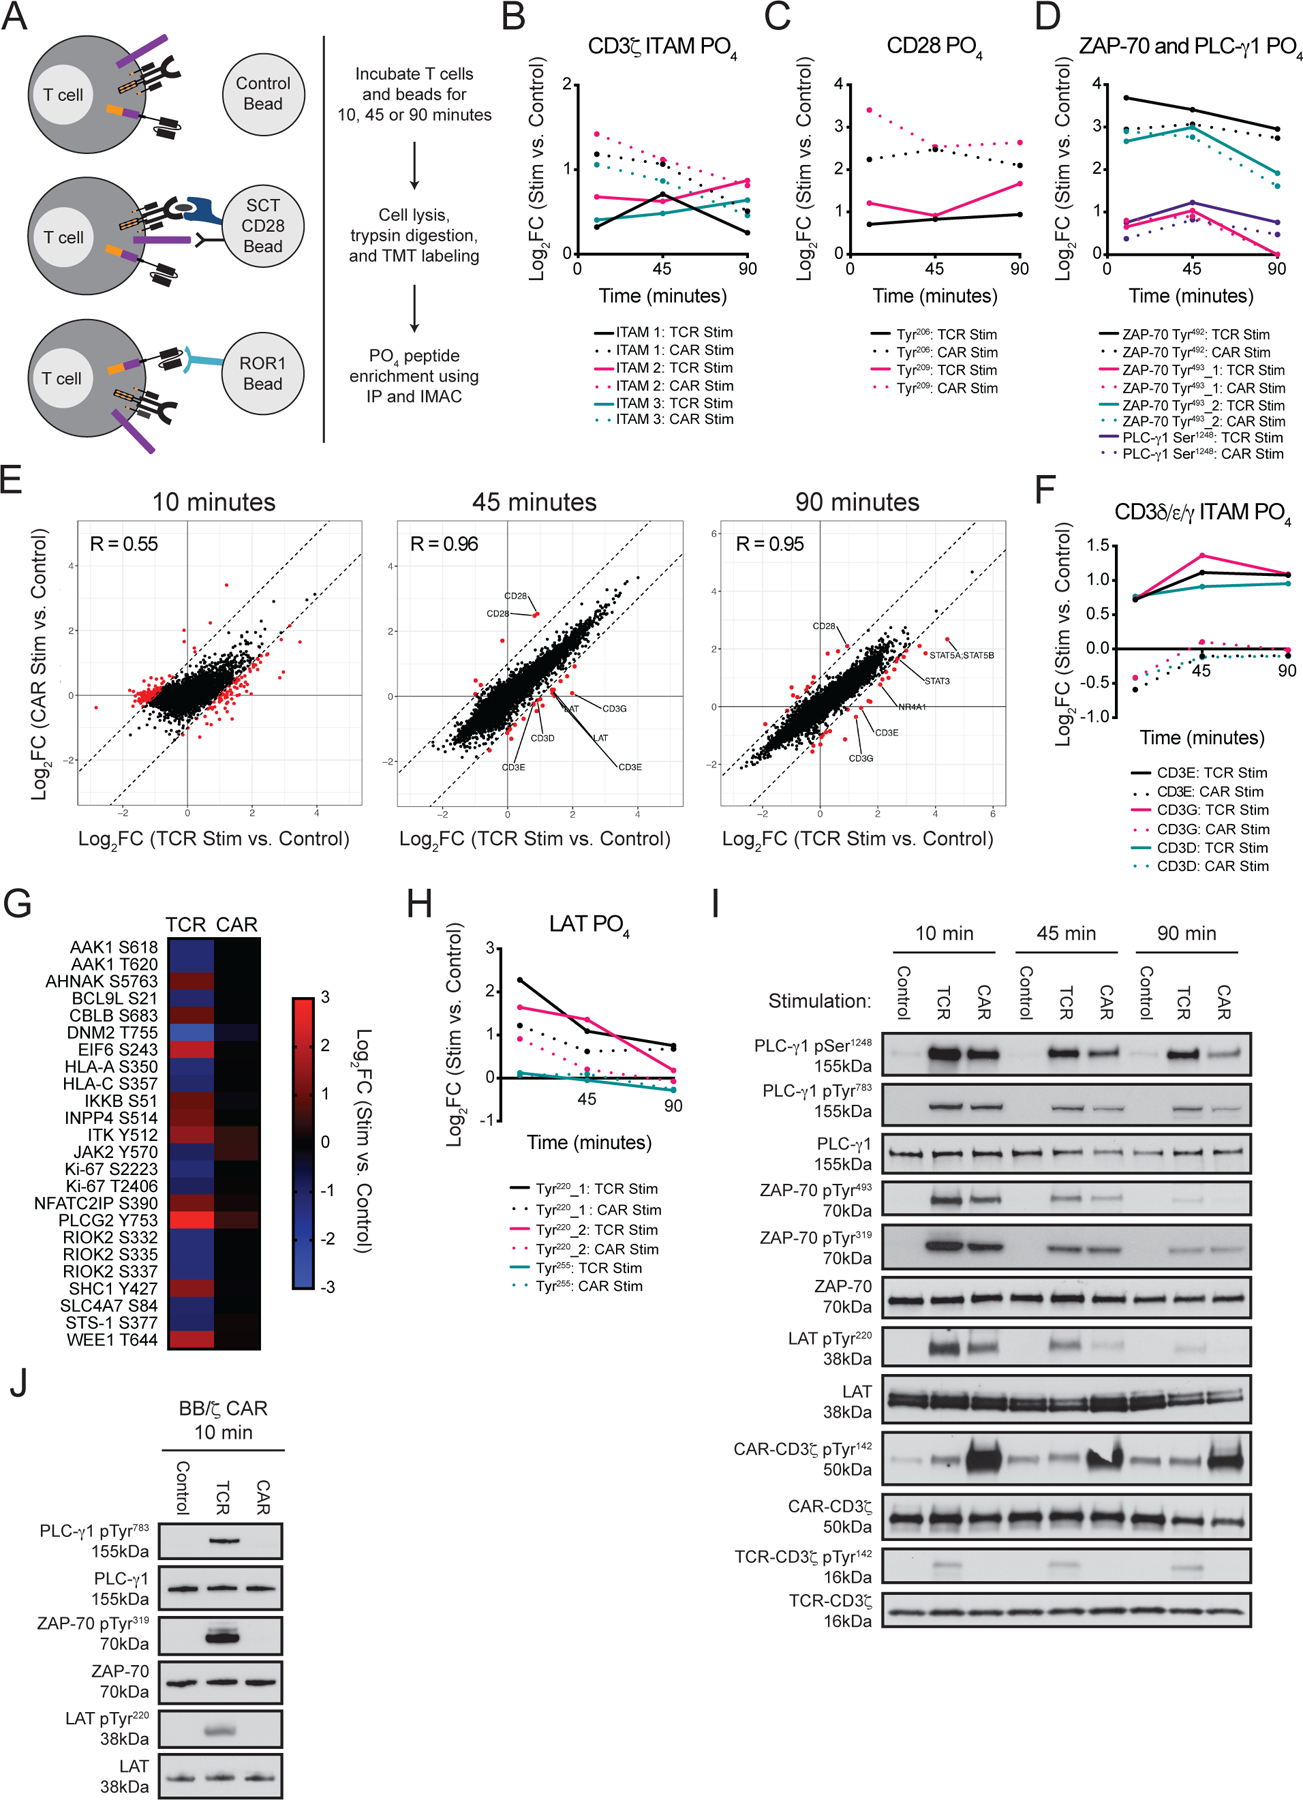
Figure 2. CAR stimulation promotes less intense phosphorylation of CD3 chains and proximal TCR signaling adaptors.

(A) Schematic of experimental design stimulating bi-specific T cells with beads coated with TCR (SCT/CD28) or CAR (ROR1) antigens. (B to D) Graphs show mean log2FC of the indicated phosphorylation (PO4) sites as depicted in (A) from two or three LC-MS/MS experiments with T cells from two unique donors. (E) Comparison of the mean log2FC of phosphorylation sites after TCR or CAR stimulation with SCT/CD28 or ROR1 beads. Red dots specify sites that possessed mean log2FC values differing by ≥ 1 between TCR and CAR stimulated samples at 10, 45, and 90 min relative to control bead stimulation. (F) Graph shows mean log2FC of phosphorylation of CD3δ, CD3ε, and CD3γ ITAMs. The log2FC in phosphorylation of both ITAM tyrosines was averaged. Data are means from two or three LC-MS/MS experiments with T cells from two unique donors. (G) Heat map shows mean log2FC of select phosphorylation sites at the 10-min time point. (H) Graph shows mean log2FC of select phosphorylation sites in LAT. (I) Western blot analysis for CD3ζ, CD3ζ pTyr142, LAT and LAT pTyr220, ZAP-70, ZAP-70 pTyr319, ZAP-70 pTyr493, PLC-γ1, and PLC-γ1 pTyr783, and PLC-γ1 pSer1248 (p = phosphorylation) in the bi-specific T cell lysates utilized for LC-MS/MS experiments. Blots are representative of three experiments using T cells prepared from two unique donors; compiled data is quantified in fig. S4A. (J) Western blot analysis for LAT, LAT pTyr220, ZAP-70, ZAP-70 pTyr319, PLC-γ1, and PLC-γ1 pTyr783 in lysates from bi-specific T cells expressing a BB/ζ CAR after 10 min of stimulation with control, SCT/CD28, or ROR1 beads. Blots are representative of three experiments using T cells prepared from two unique donors; compiled data is quantified in fig. S4B.
