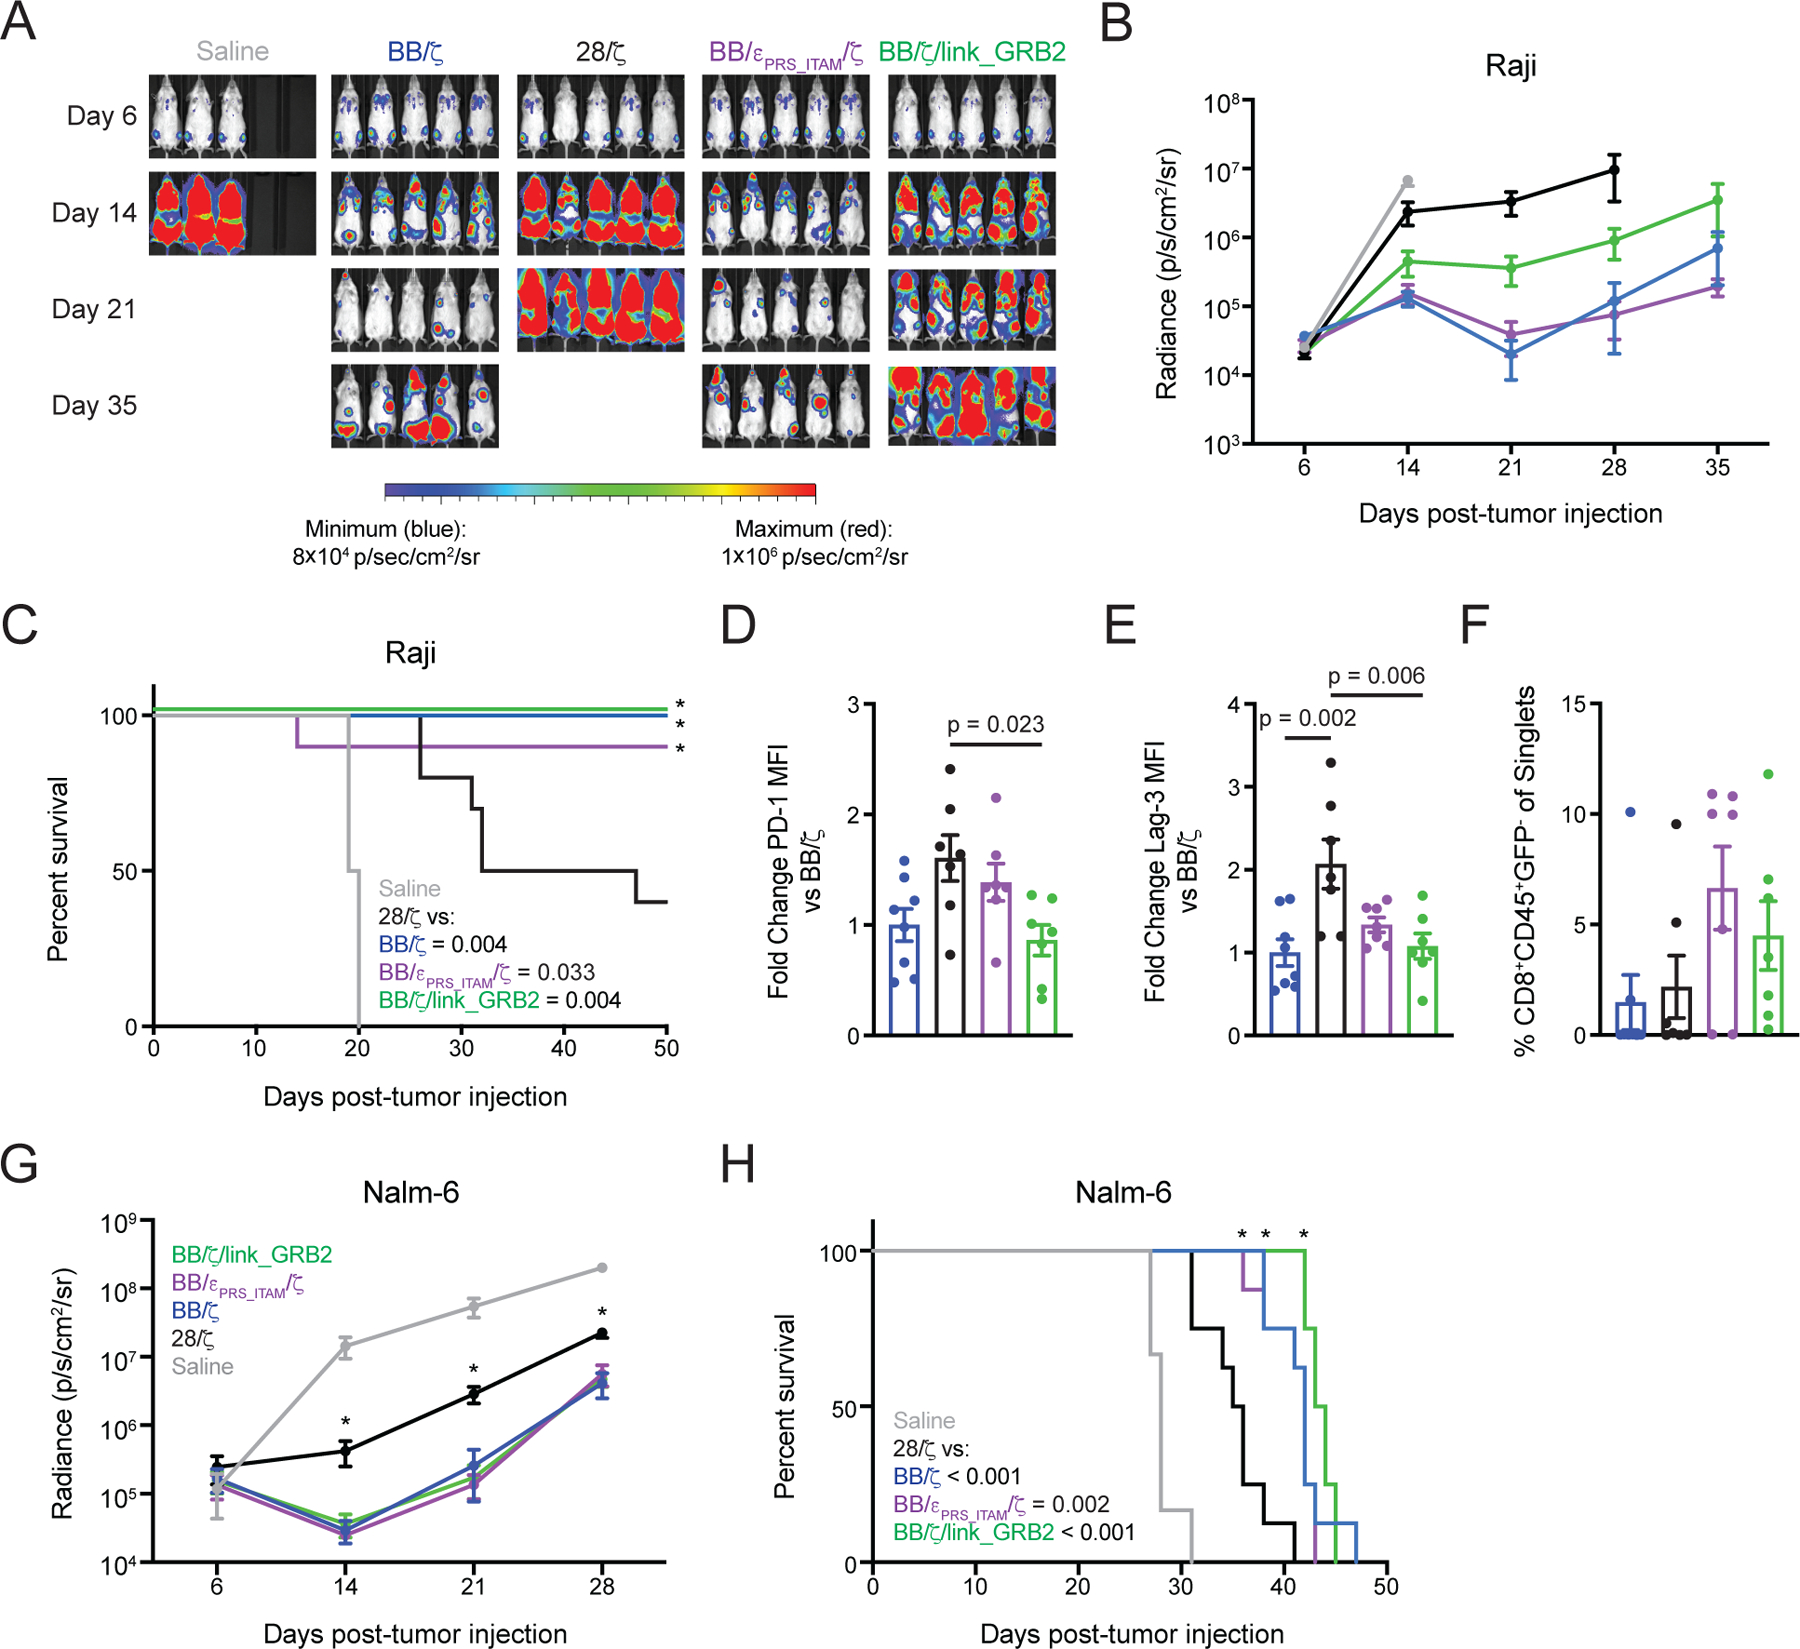
Figure 5. BB/ζ CARs containing CD3ζ or GRB2 domains maintain in vivo antitumor function in settings of high antigen expression.

(A and B) Representative bioluminescence images (A) and mean ± SEM radiance (photons/second/cm2/sr) of (B) Raji/ffluc tumor burden in mice treated with CD19-specific CD8+ CAR T cells. N = 6 or 10 mice per group pooled from two independent experiments using T cells from unique donors. (C) Survival analysis of mice as in (B). Significance (*) and P values (inset legend) were calculated by log-rank test. (D to F) Graphs show mean ± SEM of normalized PD-1 (D) and Lag3 (E) mean fluorescence intensity (MFI) on CD8+CD45+GFP- CAR T cells as well as percent frequency of such cells (F) within the bone marrow 21 days after Raji cell tumor injection. N = 7 or 8 mice per group pooled from two independent experiments using T cells from unique donors. P values by ordinary one-way ANOVA with Tukey’s post test. (G) Graph shows mean ± SEM radiance (photons/second/cm2/sr) of Nalm-6/ffluc tumor burden in mice treated with CD19-specific CD8+ CAR T cells. N = 6 or 8 mice per group pooled from two independent experiments using T cells from unique donors. Significance (* P < 0.05) was assessed by one-way ANOVA with Tukey’s post test. (H) Survival analysis of mice as in (G). Significance (*) and P values (inset legend) assessed by log-rank test.
