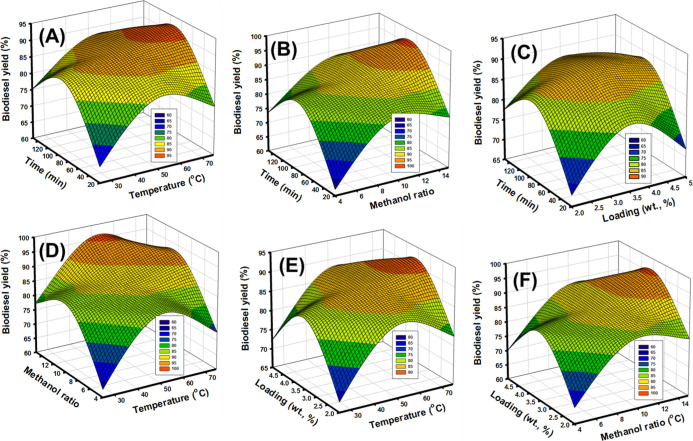
Figure 5.
3D curves or the interaction between the transesterification intervals and the temperature (A), between the transesterification intervals and the methanol content (B), between the transesterification intervals and the S-CB loading (C), the temperature and the methanol content (D), the temperature and the used S-CB loading (E), and the S-CB loading and the methanol content (F).

