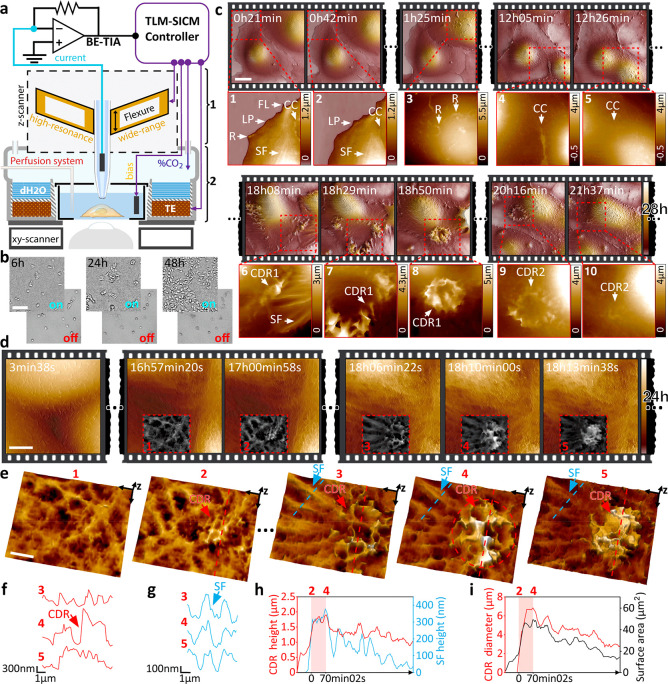
Figure 2.
Time-resolved allows long-term 3D visualization of the eukaryotic cell membrane and the tracking of dynamic structures at nanometer resolution. (a) High-performance pipet z-actuator (1) is integrated into a miniature incubator (2). (b) Demonstration of cell viability and proliferation over 48 h in our time-resolved SICM system, with controlled atmosphere ON vs OFF. Scale bar, 50 μm.(c) Twenty-eight hour time-lapse scanning of live kidney cells (COS-7) in DMEM-Hi glucose medium. Scale bar, 20 μm. Several membrane structures can be visualized: ruffles (R), lamellipodia (LP), filopodia (FL), cell–cell contacts (CC), stress fibers (SF), and CDR. (d) Twenty-four hour time-lapse scanning of live kidney cells tracking the formation of a CDR structure. Scale bar, 5 μm. (e) 3D view of the CDR with the initiation spot in panels 1 and 2 and maximum expansion in panels 3–5. Scale bar, 2 μm. (f) Height profile of the CDR ring (red arrow in f). (g) Height profile of a nearby SF protruding the cell surface (blue arrow in g). (h) Plot of CDR and SF max-height, showing colocalization during the expansion period (2–4); (i) Plot of CDR ring diameter and surface area; over 130 frames.

