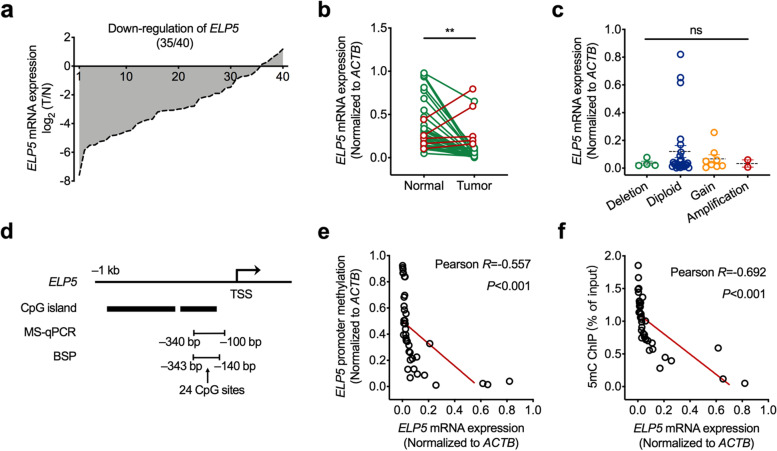
Fig. 1.
DNA hypermethylation represses ELP5 expression in GBC. a Relative expression of ELP5 in GBC tumorous tissues normalized to matched normal tissues. b Statistical analysis of ELP5 expression in GBC tumorous tissues and matched normal tissues. Paired student’s t test for statistical analysis, **P < 0.01. c Statistical analysis of ELP5 expression in GBC tissues with different DNA copy numbers. One-way ANOVA test for statistical analysis, ns, not significant. d Schematic diagram of CpG islands on ELP5 promoter region around transcription start site (TSS). e Correlation analysis between the promoter methylation levels and transcription levels of ELP5 in GBC tissues, detected by methylation-specific quantitative PCR (MS-qPCR) and real-time quantitative PCR (RT-qPCR), respectively. f Correlation analysis between the contents of 5mC in promoter and transcription levels of ELP5 in GBC tissues, detected by anti-5mC chromatin immunoprecipitation (ChIP)-qPCR and MS-qPCR, respectively

