Fig. 7.
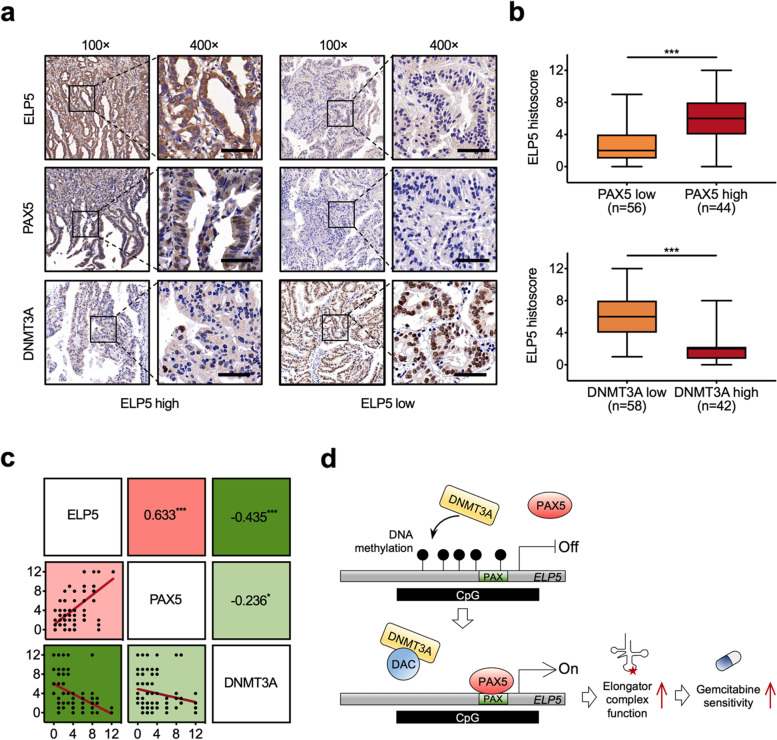
ELP5, PAX5, and DNMT3A correlate and are relevant in GBC. a Representative immunohistochemistry of ELP5 (top), PAX5 (middle), and DNMT3A (bottom) proteins in GBC tissues from patients with high or low ELP5 expression. Scale bar = 50 μm. b Statistical analysis of the histoscore of ELP5 proteins in GBC tissues from patients with high or low PAX5 expression (top), and DNMT3A expression (bottom). Student’s t test for statistical analysis, ***P < 0.001. c Correlations among ELP5, PAX5, and DNMT3A protein levels in GBC tissues. Pearson correlation coefficient for statistical analysis, *P < 0.05, ***P < 0.001. d Schematic diagram for the epigenetic activation of ELP5 by DAC enhances the gemcitabine cytotoxic effects in GBC

