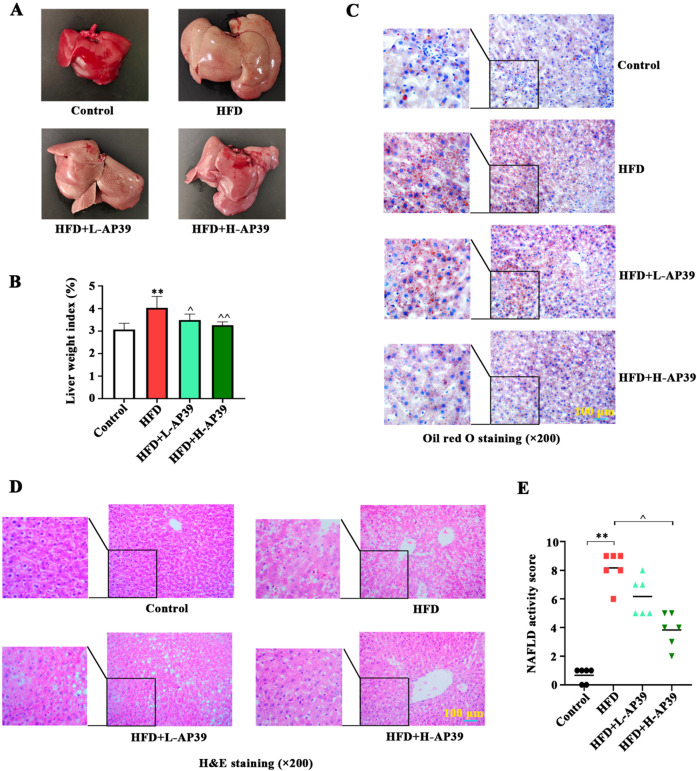
Fig. 2.
Effect of AP39 on high-fat-diet (HFD)-induced non-alcoholic fatty liver disease (NAFLD). (A) At the end of the experiment, the liver tissues were harvested. Gross morphology of liver tissue was observed. (B) Liver weight index was calculated according to the formula liver wet weight / body weight × 100%. (C, D) The histological alternations of liver tissues were visualized with Oil red O staining (×200) and hematoxylin and eosin (H&E) staining (×200), and the representative photomicrographs were shown. (E) NAFLD activity score, a histological scoring system for NAFLD, was counted. **P<0.01 vs. Control; ^P<0.05, ^^P<0.01 vs. HFD.

