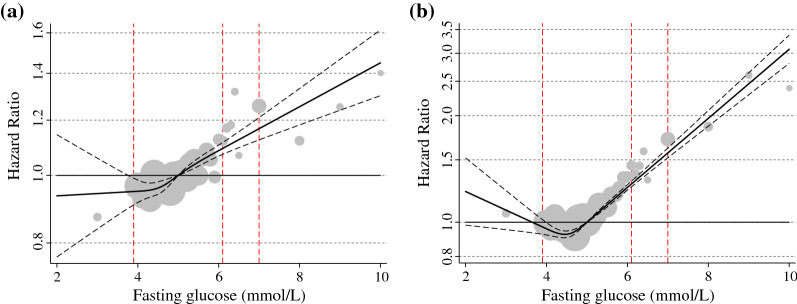
Fig. 3.
Hazard ratio and 95% confidence limits for A atrial fibrillation (left) and B heart failure (right) by fasting glucose level presented as splines. Subjects with a fasting glucose above or below 10 standard deviations not presented. Hazard ratios are adjusted for attained age as timescale, sex, total cholesterol, total triglyceride levels and socioeconomic index. The dotted lines indicate the 95% confidence interval. The grey spheres reflect the relative size of the number of subjects with respective level of fasting glucose and the red vertical lines show the cut-off value for low glucose (3.9 mmol/L), and the lower and higher limit for impaired fasting glucose (6.1 mmol/L and 6.9 mmol/L) respectively

