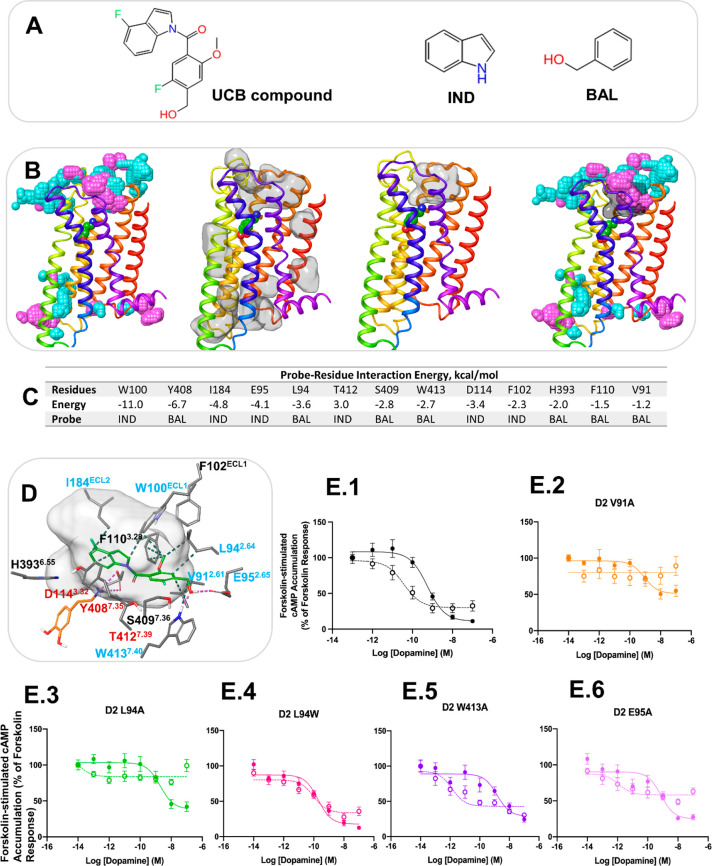
Figure 4.
Computational and experimental prediction of the allosteric site for the UCB compound in the D2 receptor. (A) The UCB compound and probe molecules used in allosteric site mapping. (B) The structure of the D2 receptor in cartoon representation with the results of MD simulation analysis. From left to right: the aggregated view of probe density from the probe simulations, IND and BAL are in cyan and purple, respectively; detectable cavities predicted by MDpocket from the MD trajectories are shown in transparent surface representation; a druggable cavity predicted by Fpocket; the overlap of probe density and a druggable cavity. (C) The probe–residue interaction energy for the residues selected from probe density and druggable cavity detection. The interaction energy < −1 kcal/mol is shown for the probe that forms the strongest interaction with a residue. (D) Docking pose of the UCB compound at the putative allosteric site. The UCB compound and dopamine are shown in green and orange sticks, respectively. Only residues selected from probe–residue interaction energy calculation are shown. The druggable cavity is shown in transparent surface representation. Labels of residues selected for mutagenesis are in blue, and labels of residues in contact with the orthosteric agonist are in red. (E) cAMP accumulation assays in the absence and presence of the UCB compound at the D2 receptor WT and mutants. Concentration–response curves of the endogenous agonist, dopamine, measuring Forskolin-induced (7.5 μM) cAMP accumulation at the D2 WT receptor (1) and the mutants V91A (2), L94A (3), L94W (4), W413A (5), and E95A (6) in the absence and presence of UCB compound 1 (10 μM). The absence of the PAM is indicated with a solid line, while the presence of 10 μM of the PAM is indicated by a dotted line. Each data point represents the mean ± SEM of triplicate wells of three independent experiments. Analysis of the pharmacological parameters for these curves can be found in Supplementary Table S3.

