

Abstract
Solvent extraction is used widely for chemical separations and environmental remediation. Although the kinetics and efficiency of this process rely upon the formation of ion–extractant complexes, it has proven challenging to identify the location of ion–extractant complexation within the solution and its impact on the separation. Here, we use tensiometry and X-ray scattering to characterize the surface of aqueous solutions of lanthanide chlorides and the water-soluble extractant bis(2-ethylhexyl) phosphoric acid (HDEHP), in the absence of a coexisting organic solvent. These studies restrict ion–extractant interactions to the aqueous phase and its liquid–vapor interface, allowing us to explore the consequences that one or the other is the location of ion–extractant complexation. Unexpectedly, we find that light lanthanides preferentially occupy the liquid–vapor interface. This contradicts our expectation that heavy lanthanides should have a higher interfacial density since they are preferentially extracted by HDEHP in solvent extraction processes. These results reveal the antagonistic role played by ion–extractant complexation within the aqueous phase and clarify the advantages of complexation at the interface. Extractants in common use are often soluble in water, in addition to their organic phase solubility, and similar effects to those described here are expected to be relevant to a variety of separations processes.
Short abstract
Observations of lanthanide ions and HDEHP extractants at the aqueous−vapor interface suggest an unexpected role for aqueous complexation and speciation in the process of liquid−liquid extraction.
1. Introduction
The extractant-assisted transport of rare earth metal ions across the liquid–liquid interface between immiscible aqueous and organic phases underlies their separation and purification by solvent (i.e., liquid–liquid) extraction processes.1,2 In spite of the importance of rare earth ions to a diverse range of critical and evolving technologies,3−5 the separation mechanism on the nanoscale is not well understood. This mechanism relies upon the interaction and complexation of metal ions with organic extractants, but the location of this complexation within the solution, i.e., at the interface, in the boundary layer near the interface, or in one of the bulk phases, is not known for extractants soluble in both phases.
Early studies of the solvent extraction of the lanthanide (Ln) elements, which make up most of the rare earths, demonstrated the utility of organophosphoric acid extractants such as bis(2-ethylhexyl) phosphoric acid (HDEHP) dissolved in organic solvents.6 When the organic phase is placed in contact with an immiscible aqueous phase of lanthanides, HDEHP complexes with lanthanide ions and extracts them into the bulk organic phase. This extraction can be more efficient for some lanthanides than for others, leading to its use to separate and purify individual lanthanide elements. Generally, lanthanides are divided into two groups, based upon their position in the lanthanide (4f element) series: light and heavy lanthanides. The separation of lanthanides from different groups is relatively easy compared with those located within the same group. For example, the separation factor between the light lanthanide neodymium, Nd, and the heavy lanthanide erbium, Er, can reach about 100, indicating that the process can easily separate these two elements. However, the separation factor between neighboring lanthanides is usually between 1 and 2, indicating that the process shows only a slight preference for one element over the other.7 As a result, separation of neighboring lanthanides often involves repeated cycling of the extraction process, complicating the process of separations and increasing the cost of production and the risk of environmental pollution.8,9 Although a great effort has been made during the past 50 years to improve the separation of lanthanides by optimizing the extraction process conditions and synthesizing new extractants, there is still a need to better understand the extraction mechanism on the molecular scale in order to optimize the separation of neighboring lanthanides or even those within a single group.
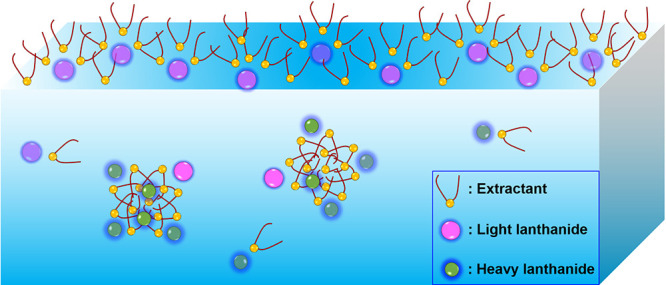
The weak amphiphilic nature of many extractants suggests that the formation of metal ion–extractant complexes occurs preferentially at the organic–aqueous interface.10−13 Many extractants contain a hydrophilic, polar headgroup responsible for interacting with metal ions in the aqueous phase and a hydrophobic tailgroup that provides solubility in the organic phase. Interfacial tension measurements demonstrate significant interfacial activity of extractants, which tend to accumulate at the organic–aqueous interface, where their encounter with metal ions is likely to occur.11,14 However, investigations into the kinetics of lanthanide ion complexation and transport have suggested that extractants can bind to ions either at the interface (Path 1 in Figure 1) or in the region of the aqueous phase boundary layer near the interface if the extractants are also water-soluble, as is often the case (Path 2 in Figure 1). The mass transfer with chemical reaction (MTWCR) mechanism includes the possibility illustrated by Path 2 that water-soluble acidic extractants, such as HDEHP, are transferred into the aqueous boundary layer near the organic–aqueous interface, where they are deprotonated and interact with metal ions to form aqueous ion–extractant complexes, which subsequently diffuse into the organic phase.15−17 Similar effects have been observed with transition metals. An example is the extraction of Zn(II) with diphenylthiocarbazone (dithizone) for which kinetics studies suggested complexation in the bulk aqueous phase as in Path 2.18 Subsequent kinetics studies of more hydrophobic variants of dithizone suggested that complexation occurs at the interface as in Path 1.10 The relative advantage of ion–extractant complexation occurring either at the interface or in the aqueous phase is not well explored and is addressed here in the context of HDEHP extraction of trivalent lanthanides.
Figure 1.

Two locations of ion–extractant complexation define the initial state of two different paths for transport of ions across the liquid–liquid interface during solvent extraction. Path 1 starts at the interface as the location of initial ion–extractant complexation. Path 2 starts in the aqueous phase boundary layer as the location of initial complexation.
Interface-sensitive experimental methods have begun to probe the structure of interfacial ion–extractant complexes and the role of hydrogen bonding in their formation and stabilization at the aqueous–organic interface.19−25 For instance, a thermal switch was developed to arrest interfacial complexes of lanthanides and water-insoluble extractants formed in the midst of the extraction process, thereby allowing for the characterization of intermediate interfacial states by X-ray scattering.21,22 Model systems of water-insoluble surfactant monolayers at the liquid–vapor interface have also been studied by interface-sensitive methods to explore the interactions between ions and surfactants whose headgroups mimic those of weakly amphiphilic extractants.26−37 Although studies at the liquid–vapor interface cannot model ion transport through the interface or structures that may form uniquely at a liquid–liquid interface, they may be able to model many aspects of the nanoscale variation of density, dielectric properties, and water structuring near a liquid interface that can influence ion–extractant complexation. However, studies of water-insoluble surfactants or extractants cannot address the issue of the location of complexation of water-soluble extractants.
Recently, Kusaka and Watanabe studied the liquid–vapor interface of aqueous solutions containing water-soluble HDEHP and lanthanide ions.38,39 They used vibrational sum frequency generation spectroscopy measurements to suggest the coordination of ion–extractant complexes at the interface. Here, we study the liquid–vapor interface of aqueous solutions containing lanthanide chlorides and water-soluble HDEHP (Chart 1) with tensiometry, X-ray reflectivity, and X-ray fluorescence. By omitting the bulk organic phase, these studies restrict interactions of HDEHP with trivalent lanthanide ions to the bulk aqueous phase, the aqueous boundary layer near the interface, and the liquid–vapor interface. This allows us to explore the consequences of ion–extractant complexation occurring either in the aqueous phase or at the interface. Unexpectedly, we find that light lanthanides preferentially occupy the water–vapor interface. This contradicts our expectation that heavy lanthanides should have a higher interfacial density since they are preferentially extracted by HDEHP in the presence of an organic phase.6,7 We also examined the complexation between Ln ions and a monolayer of insoluble dihexadecyl phosphoric acid (DHDP in Chart 1), which has the same phosphoric acid headgroup as HDEHP but is confined to the aqueous liquid–vapor interface. In this case, we found an enhanced presence of heavy over light Ln ions, as expected. A comparison of these results reveals the antagonistic role played by ion–extractant complexation within the aqueous phase.
Chart 1. Molecular Structure of (A) HDEHP and (B) DHDP.

2. Results
2.1. Solutions
Aqueous solutions of water-soluble HDEHP at a concentration of 10 ± 1 μM and a 6:1 mole ratio of HDEHP:Ln for each lanthanide in solution were studied (SI Section 1.1 for solution preparation). The ratio 6:1 was chosen based upon known values of HDEHP complexation with lanthanides in bulk organic phases but may not necessarily represent the complexation ratio for the bulk aqueous phases studied here because the speciation of HDEHP and lanthanides in bulk water is unknown.7,40 The pH values used in these measurements span a range for which the phosphoric acid extractant in bulk water is mostly protonated (HDEHP) at pH 2.0, is mostly deprotonated (DEHP–) at pH 4.5, and is present in intermediate quantities of both protonated and deprotonated species at pH 3.0 (SI Section 1.2). Note, however, that the presence of lanthanide ions can change the relative amount of protonated and deprotonated species as the proton and the Ln(III) compete for DEHP–. The shorthand notation (H)DEHP will be used in contexts that do not distinguish between DEHP– and HDEHP species.
2.2. Surface Tension Measurements
Figure 2 presents surface tension measurements from the liquid–vapor interface of aqueous solutions of (H)DEHP and a series of lanthanide chlorides for three values of pH (2.0, 3.0, and 4.5). The curves in Figure 2 illustrate the variation of surface tension with time as well as equilibrium values (SI Section 1.3). In the absence of lanthanide ions, aqueous solutions of (H)DEHP have an equilibrium value of surface tension that decreases as the pH is lowered. Aqueous solutions containing (H)DEHP and lanthanide chlorides at pH 2.0, 3.0, or 4.5 produce an equilibrium surface tension that is highest for solutions containing the heaviest lanthanide ions (Lu) and sequentially lower for solutions containing lighter lanthanide ions (from Lu to Er, Dy, Gd, Nd, and La). X-ray measurements presented later will confirm the interpretation of these surface tension measurements that surface adsorption is greater in the presence of lighter lanthanides.
Figure 2.

Surface tension measurements. Relaxation and equilibrium values of the liquid–vapor surface tension of (H)DEHP-aqueous solutions in the absence (“no Ln ions”) or presence of lanthanide chlorides. (A) pH 2.0, (B) pH 3.0, (C) pH 4.5, where the vertical order of the surface tension curves for Ln from top to bottom follows the order in the legend. (D) Equilibrium values of the surface tension vs atomic number [La(57), Nd(60), Gd(64), Dy(66), Er(68), Lu(71)] for different values of pH, where dashed lines indicate the values in the absence of lanthanide ions (Table S1 lists the values). Surface tension curves for a mixed monolayer containing Er and Nd are shown in Figure S2.
Figure 2 also illustrates the kinetics of attaining equilibrium. It is generally observed that solutions with lighter lanthanides equilibrate quickly, more or less at the rate with which (H)DEHP equilibrates in the absence of Ln ions, but the kinetics are slower for solutions with heavier lanthanides. Similar Ln extraction kinetics have been reported for the TALSPEAK system: 1 M HDEHP/0.05 M DTPA in a lactate buffer.41−43 The slow equilibration is particularly apparent at pH 4.5 where it can be observed that the surface tensions for the single-Ln-ion component samples containing Er and Lu ions persist at values near that of pure water for 100 min or more, suggesting that these ions stabilize an interface that has little extractant even on time scales much longer than required for the equilibration of (H)DEHP in the absence of Ln ions. Eventually, the surface tension relaxes to values lower than that of pure water, e.g., 66.6 mN/m for Er ions, indicating a slow adsorption to the liquid–vapor interface, an adsorption that is confirmed by X-ray measurements, as discussed later. On the other hand, the surface tension of solutions with lighter lanthanides, for example, Nd ions, relaxes on the same time scale as in the absence of ions, suggesting that the relaxation is dominated by the adsorption kinetics of (H)DEHP to the interface. Similar effects are observed to a lesser extent at pH 2.0 and 3.0.
2.3. Electron Density Profiles of the Surface Layer
X-ray reflectivity measures the electron density profile with sub-nanometer resolution, where the profile is the variation in electron density along the interfacial normal but averaged over the X-ray footprint in the plane of the liquid–vapor interface (SI Sections 1.4 and 1.5).44 Since the interfacial region may consist of different components—water, (H)DEHP, and lanthanide ions—each with a different electron density, X-ray reflectivity can reveal the arrangement of these components at the interface. However, X-ray reflectivity cannot distinguish between HDEHP and DEHP– because of the small difference in electron density between them. Element-specific information that distinguishes one lanthanide from another will be measured by X-ray fluorescence, which is discussed in the next section. X-ray measurements used 10 keV X-rays with the liquid surface scattering instrument at Sector 15, NSF’s ChemMatCARS, of the Advanced Photon Source at Argonne National Laboratory.45,46
We have limited our X-ray studies of these systems to aqueous solutions containing (H)DEHP without Ln ions, (H)DEHP with a representative heavy lanthanide, Er(III), and a representative light lanthanide, Nd(III), as well as (H)DEHP with a 1:1 mixture of these two lanthanides. Figure 3 illustrates X-ray reflectivity measurements from the liquid–vapor interface of these aqueous samples whose composition and pH are identical to those measured with tensiometry. The lowest curves shown in Figure 3A–C for each pH illustrate the measurement of aqueous solutions containing water-soluble (H)DEHP without Ln ions. Other curves in Figure 3A for pH 2.0 samples with Ln ions are not greatly different. A broad peak develops at Qz ≈ 0.2 Å–1 for most of the samples with Ln ions at pH 3.0 and 4.5 except for the one with only Er ions at pH 3.0.
Figure 3.

X-ray reflectivity measurements and analysis. (A–C) X-ray reflectivity R normalized to the Fresnel reflectivity RF as a function of wave vector transfer Qz normal to the surface. Measurements are from the liquid–vapor interface of equilibrated aqueous samples for three different values of pH: (A) pH 2.0, (B) pH 3.0, and (C) pH 4.5. The samples contained (H)DEHP, ErCl3, and NdCl3 at the same concentrations used for the surface tension measurements shown in Figure 2 and Figure S2. The label “Er+Nd” indicates a 1:1 mixture of ErCl3 and NdCl3; “no Ln ions” refers to aqueous solutions that contain (H)DEHP but not lanthanide ions. Data are displaced for visual clarity with the vertical placement of data sets corresponding to the ordering in the legend. Note that all measured reflectivity curves approach 1 as Qz approaches 0. Lines represent the best fits of the reflectivity data. (D–F) Electron density profiles as a function of the distance z normal to the liquid–vapor interface. The vapor above the interface occurs at z ≪ 0 and the bulk aqueous phase at z ≫ 0. The dash–dot line in panel D displays a zero-roughness profile to illustrate the thickness d and electron density ρ of the interfacial slab. The profiles are the result of the fits shown in panels A–C, respectively.
All reflectivity curves are fitted with a simple model of the electron density profile illustrated by the dash–dot line in Figure 3D. This profile consists of a single homogeneous slab of thickness d and electron density ρ on top of an aqueous bulk phase represented by a homogeneous electron density. The interface slab represents a layer composed of (H)DEHP, water, and lanthanide ions. In order to fit reflectivity data, the profile is convoluted with a Gaussian function to account for capillary wave fluctuations of the interface.44 Note that the slab illustrated by the dash–dot line in Figure 3D is drawn in the absence of capillary wave roughening (Figure S4 shows zero-roughness profiles for all data sets).
Figure 3D–F illustrates the electron density profiles that result from fits to the data in Figure 3A–C. The lines in Figure 3D–F indicate the values of the electron density in the vapor and bulk aqueous phases, 0 and 0.333 e–/Å3 at large negative and positive z, respectively, as well as the gradual crossover from the water-saturated helium vapor above the solution through the aqueous interfacial layer to the aqueous bulk phase. The gradual crossover is primarily the result of thermal capillary waves that roughen the surface. The electron density in the interfacial region rises above the value of the bulk aqueous phase. This additional electron density is the result of adsorption of (H)DEHP and ions to the surface of the aqueous solution. It is apparent that the development of a broad peak at Qz ≈ 0.2 Å–1 for most of the samples with Ln ions at pH 3 and pH 4.5 is the result of the enhanced electron density at the interface shown in Figure 3E,F.
The slab that represents the interfacial layer is described by three parameters: the layer thickness d, the layer electron density ρ, and the interfacial roughness σ. Table 1 lists the values of these parameters determined by fits to the X-ray reflectivity data. The interfacial layer is thin, with a thickness that varies from 7 to 9 Å. The resolution of these X-ray reflectivity measurements is inadequate to distinguish the location of lanthanide ions separately from the location of (H)DEHP within this thin interfacial layer. The electron density of the interfacial layer is 4–30% larger than the electron density of pure water, depending upon the sample composition. The interfacial roughness varies from 3 to 3.6 Å and is primarily due to capillary wave fluctuations of the interface.44
Table 1. Fitting Parameters from X-ray Reflectivity Measurementsa.
| pH | ions | d (Å) | ρ (e–/Å3) | σ (Å) |
|---|---|---|---|---|
| 2.0 | none | 8.4–1.1+0.7 | 0.353–0.003+0.008 | 3.2–0.1+0.2 |
| Er | 8.3–1.3+0.8 | 0.351–0.003+0.009 | 3.1–0.2+0.1 | |
| Nd | 8.1–1.2+0.4 | 0.36–0.01+0.03 | 3.3–0.2+0.1 | |
| Nd + Er | 7.1–0.8+1.6 | 0.364–0.003+0.09 | 3.1–0.2+0.1 | |
| 3.0 | none | 9.3–0.6+0.4 | 0.359–0.003+0.005 | 3.2–0.2+0.1 |
| Er | 8.8–0.6+0.4 | 0.354–0.003+0.002 | 3.0–0.1+0.1 | |
| Nd | 7.3–0.9+0.6 | 0.42–0.02+0.02 | 3.6–0.1+0.1 | |
| Nd + Er | 7.4–0.7+0.6 | 0.43–0.01+0.02 | 3.5–0.1+0.2 | |
| 4.5 | none | 9.9–0.5+0.4 | 0.346–0.001+0.001 | 3.0–0.1+0.1 |
| Er | 7.1–0.6+0.8 | 0.43–0.01+0.02 | 3.2–0.1+0.2 | |
| Nd | 7.7–0.8+0.6 | 0.44–0.02+0.02 | 3.5–0.1+0.2 | |
| Nd + Er | 7.7–0.8+0.6 | 0.44–0.01+0.02 | 3.4–0.1+0.1 |
Parameters: layer thickness d; layer electron density ρ; interfacial roughness σ. Uncertainties on the parameters are determined by mapping the chi-squared space.47
As expected from the nearly identical reflectivity curves and corresponding electron density profiles measured for pH 2.0 samples, the parameters in Table 1 that describe the profiles of these samples are the same within experimental uncertainty. Samples containing Nd ions at pH 3.0 and all samples with Ln ions at pH 4.5 form thinner layers than in the absence of ions, but with higher electron density. This suggests that Ln ions alter the (H)DEHP conformation at the surface. Note, however, that the thinning of the layer is not observable in Figure 3E,F because the larger roughness for these samples smears the profile in the z-direction. The electron density ρ is significantly larger for Nd-containing samples at pH 3.0 and for both Er- and Nd-containing samples at pH 4.5, indicating substantial ion density at the liquid–vapor interface which will be verified by X-ray fluorescence in the next section.
2.4. Ion-Specific Interfacial Density
Although X-ray reflectivity measures the electron density profile resulting from all species at the liquid–vapor interface, it does not identify the presence of specific elements. Therefore, X-ray fluorescence near total reflection (XFNTR, SI Section 1.6) was used to measure the element-specific interfacial density in units of number of ions per area for the same samples studied by X-ray reflectivity. Figure 4A illustrates the increase in XFNTR signal with pH for equilibrated samples containing either Nd or Er ions. Analysis of these signals relies upon the measurement of a scale factor that differs for Nd and Er (Figure S6), such that the same interfacial density of fluorescing ions produces a larger signal for Er than for Nd. An analysis of these data is summarized in Figure 4C, which demonstrates the increase in the interfacial density of ions as the pH increases from 2.0 to 4.5. More Nd ions are adsorbed to the interface than Er ions at each value of pH. Table 2 displays values of the interfacial area per ion, just the reciprocal of the ion interfacial density shown in Figure 4C.
Figure 4.

X-ray fluorescence near total reflection (XFNTR) as a function of the wave vector transfer Qz near the critical Qc ≈ 0.217 Å–1 for total reflection. Measured sample concentrations are the same as those in Figure 3. (A, C) Measurements from equilibrated samples containing single Ln ionic components, either Nd or Er at pH 2.0, 3.0, or 4.5. (B, D) Measurements from equilibrated samples containing a mixture of Nd and Er ions, each at a 6:1 ratio of (H)DEHP:ion, at pH 2.0, 3.0, or 4.5. (A, B) The XFNTR signal axis scale is the same for all samples, though the pH 2.0 data have been multiplied by a factor of 10. (C, D) Interfacial density of ions (number per area) at different pH values (Table S2). Note that in panels A and B the interfacial density scales differently with the XFNTR signal for Nd and Er due to the difference in X-ray fluorescence yields for these two elements (Figure S6). Insets to panels A and B indicate that ions and (H)DEHP can be either at the interface or in the bulk aqueous phase, though XFNTR detects ions at the interface.
Table 2. Interfacial Area per Ion (in Å2) of Nd and Er Measured by XFNTRa.
| single
Ln ion samples |
mixture of Ln ions |
|||
|---|---|---|---|---|
| pH | Nd | Er | Nd | Er |
| 2.0 | 4700 (200) | 19 900 (1600) | 5300 (200) | 16 000 (3000) |
| 3.0 | 400 (20) | 6500 (300) | 360 (20) | BDLb |
| 4.5 | 240 (10) | 310 (10) | 240 (10) | BDL |
Estimated standard deviations at the one-sigma level are shown in parentheses and were determined by mapping the chi-squared space.47
BDL, below detection limit (≳50 000 Å2).
Aqueous samples of (H)DEHP that contain a 1:1 mixture of NdCl3 and ErCl3, both in a ratio of 6:1 (H)DEHP:ion, demonstrate the result of competitive adsorption between these Ln ions. Under these conditions, Figure 4B,D and Table 2 demonstrate that the density of Er ions at the interface drops to very low levels as Nd dominates the surface adsorption at all values of pH. The surface adsorption of Nd ions in mixtures with Er ions is similar to that in the absence of Er ions.
2.5. Safety Statement
No unexpected or unusually high safety hazards were encountered.
3. Discussion
These studies of trivalent lanthanide ion adsorption to the liquid–vapor interface of aqueous electrolyte solutions containing the water-soluble extractant (H)DEHP demonstrate the preferential adsorption of light over heavy lanthanides. Measurements were presented from three kinds of solutions: (1) single-Ln-component solutions with (H)DEHP, (2) solutions of two lanthanides (Nd and Er) with (H)DEHP, and (3) solutions of (H)DEHP without lanthanides. It is worthwhile noting that surface tension and X-ray measurements of aqueous solutions of lanthanide chlorides at the micromolar concentrations used in these experiments, but in the absence of (H)DEHP, are essentially indistinguishable from measurements of the surface of pure water.
3.1. Preferential Adsorption of Lighter Lanthanides at the Surface of Water-Soluble HDEHP Solutions
Figure 2 showed that the surface tensions of single Ln-component solutions become successively lower with decreasing lanthanide mass from Lu to Er, Dy, Gd, Nd, and La for each pH studied (2.0, 3.0, and 4.5). X-ray measurements in Figures 3 and 4 compared the behavior of aqueous (H)DEHP solutions with Nd ions, a light lanthanide, to solutions with Er ions, a heavy lanthanide. The enhanced electron densities measured by X-ray reflectivity occur primarily at higher pH (3.0 and 4.5) in the presence of the lighter Nd ions, though a significant, but slightly lower, electron density is also observed for the heavier Er ions at the highest pH of 4.5 (Figure 3). X-ray fluorescence measurements (XFNTR) demonstrate that the interfacial density of Nd ions is larger than that of Er ions at the liquid–vapor interface of single Ln-component solutions for all pH values studied (Figure 4C). Studies of solutions containing both Nd and Er ions reveal an overwhelming preference for ions of the lighter lanthanide, Nd, at the liquid–vapor interface, again, for all pH values studied (Figure 4D).
3.2. pH Dependence in the Absence of Ln Ions
Varying pH has a substantial impact on the results, most likely due to the varying degree of protonation of (H)DEHP in the bulk aqueous phase. The fraction of protonated species, HDEHP, can be calculated, in the absence of Ln ions, to vary from 95% at pH 2.0 to 63% at pH 3.0 to 5% at pH 4.5 (Figure S1). This variation influences the surface tension even in the absence of Ln ions. At pH 4.5, without Ln ions, the concentration of both HDEHP and DEHP– are below their respective values of critical aggregation concentration (CAC), 1.6 μM (Figure S3) and 18 mM.48 The surface tension is reduced to 66.5 mN/m, only slightly below that of pure water at 72 mN/m, indicative of a small adsorption of (H)DEHP to the interface. At pH 3.0, without lanthanide ions, the concentration of HDEHP has risen above its CAC, though DEHP– is still far below its CAC, likely making HDEHP the dominant contribution to the reduction in surface tension to 54.1 mN/m. At pH 2.0, without lanthanide ions, the surface tension is further reduced to 43.8 mN/m. In the absence of ions, the reduction in surface tension with pH follows the increase in concentration of the protonated species, HDEHP, which is expected to be the predominant species at the interface at these values of pH in the absence of Ln ions.
3.3. pH Dependence with Ln Ions
The surface tension measurements shown in Figure 2 suggest that (H)DEHP adsorption in the absence of ions is strongest at pH 2.0; however, when Nd or Er ions are present in solution, their adsorption is weakest at this pH. This is demonstrated by XFNTR measurements shown in Figure 4 that measured the area per ion at the interface to be 4700 Å2 for Nd ions to nearly 20 000 Å2 for Er ions. Under these low pH conditions, the nearly fully protonated interfacial monolayer is resistant to adsorption of either Nd or Er ions or (H)DEHP complexes containing them. At pH 2.0, the measured surface tension value in the presence of Nd ions is slightly higher than the value without ions and is much higher in the presence of Er ions (Figure 2D). Both results suggest that the amount of interfacial (H)DEHP is reduced in the presence of ions, though the resolution of the X-ray reflectivity measurements is not sufficient to confirm this.
At the intermediate pH 3.0, XFNTR measurements shown in Figure 4A reveal substantial adsorption of Nd ions but small to negligible adsorption of Er ions (Table 2). This is consistent with the increase in electron density measured by X-ray reflectivity for Nd-containing samples, either single-Ln-component or mixed Nd+Er ion solutions (Figure 3E). At this pH, the surface tension for single-ionic-component Nd solutions is nearly the same as in the absence of ions (Figure 2D), suggesting an adsorption of Nd–(H)DEHP complexes at the interface whose interfacial density is similar to that of (H)DEHP in the absence of Ln ions. Surface tensions of solutions containing Er ions are higher than for solutions without Ln ions, again suggesting the reduction in the amount of interfacial (H)DEHP in the presence of Er ions.
Although (H)DEHP adsorption in the absence of Ln ions appears to be low at pH 4.5, ion adsorption is greatest at this pH as demonstrated by XFNTR measurements in Figure 4 that measure the area per ion at the interface to be roughly 240 Å2 (Table 2). A substantial adsorption at the surface of solutions with Nd ions is consistent with the reduction in surface tension by 10.3 mN/m below the value for HDEHP solutions without Ln ions. A substantial adsorption is also observed when Er ions are in the solution, even though its equilibrium tension value is essentially unchanged from the value without Ln ions. The very long equilibration time for Er at this pH, in which the surface tension remains close to the value for pure water (Figure 2C), and XFNTR measurements reveal only a small adsorption of Er ions for roughly 100 min (Figure S7), suggests that complexation in the bulk aqueous solution plays an important role.
3.4. Complexation in the Bulk Aqueous Solution
The measurements of single-Ln-component HDEHP solutions show that Nd–extractant complexes adsorb to the interface to a greater extent than Er–extractant complexes under otherwise similar conditions. Either the Nd–(H)DEHP species have more favorable interactions with the interface, or they have less favorable interactions with the bulk aqueous phase or, possibly, a combination of the two. Considering the surface tension kinetics discussed in the previous section which suggests the importance of bulk complexation, we discuss our results in the context of the hypothesis that Nd–(H)DEHP species have less favorable interactions with the bulk aqueous phase. Stated another way, Nd–extractant species are more hydrophobic than Er–extractant species. More generally, the surface tension measurements of HDEHP solutions with other lanthanides suggest that lighter Ln ion–extractant complexes in the bulk aqueous phase are more hydrophobic (or, equivalently, less hydrophilic) than those formed by heavier lanthanides.
This hypothesis explains the pH variation shown in Figure 2D of the surface tension of solutions with different lanthanides relative to the values without Ln ions. At pH 4.5, Figure 2D shows that heavier lanthanides do not greatly change the surface tension from the value without Ln ions, but lighter lanthanides lower the surface tension significantly. If lighter Ln ion–extractant complexes are more hydrophobic than the hydrophilic DEHP– present at this pH, then these complexes will go to the surface and reduce the surface tension. The more hydrophilic heavier Ln ion–extractant complexes will preferentially stay in the bulk, as will the hydrophilic DEHP– for solutions without Ln ions; therefore, the surface tension will be high in both cases. In contrast to this behavior at pH 4.5, Figure 2D shows that at pH 2.0 lighter lanthanides do not change the surface tension from the value without Ln ions, but heavier lanthanides raise the surface tension. Hydrophobic ion–extractant complexes formed by lighter lanthanides may not change the tension much in comparison to solutions without Ln ions which consist primarily of electrically neutral hydrophobic HDEHP. However, stronger interactions of heavier lanthanides with (H)DEHP, described next, can stabilize (H)DEHP in the bulk phase and raise the surface tension.
It is reasonable to expect that lighter and heavier lanthanides will interact differently with (H)DEHP in the bulk aqueous phase as a result of the lanthanide contraction, which expresses the fact that heavier lanthanides have smaller radii. For example, the Er(III) ionic radius is smaller than Nd(III) by 11 pm.49 Therefore, Er(III) has a higher effective charge than Nd(III), that is, while they have the same formal charge (+3), the smaller Er ion has a larger electric field which interacts more strongly with charged DEHP–. The stronger interaction in aqueous solution is demonstrated in Figure 5 by a molecular dynamics (MD) simulation of the potential of mean force (or free energy profile) of each ion interacting separately with DEHP– in bulk aqueous solution. The free energy minimum is lower for the Er–DEHP– complex by 2.2 kcal/mol, and the equilibrium distance of the ion to the phosphorus atom in DEHP– is slightly smaller for Er(III). At pH 3.0 and pH 4.5, where DEHP– is the dominant species in the bulk aqueous phase, this stronger interaction is expected to lead to greater complexation of DEHP– with Er(III) in the bulk solution. This stronger interaction with Er may form a more stable bulk complex that also has the effect of stabilizing (H)DEHP in the bulk aqueous phase. This is consistent with our surface tension measurements that suggest that the presence of Er can reduce the amount of interfacial (H)DEHP, most likely by stabilizing it in the bulk.
Figure 5.
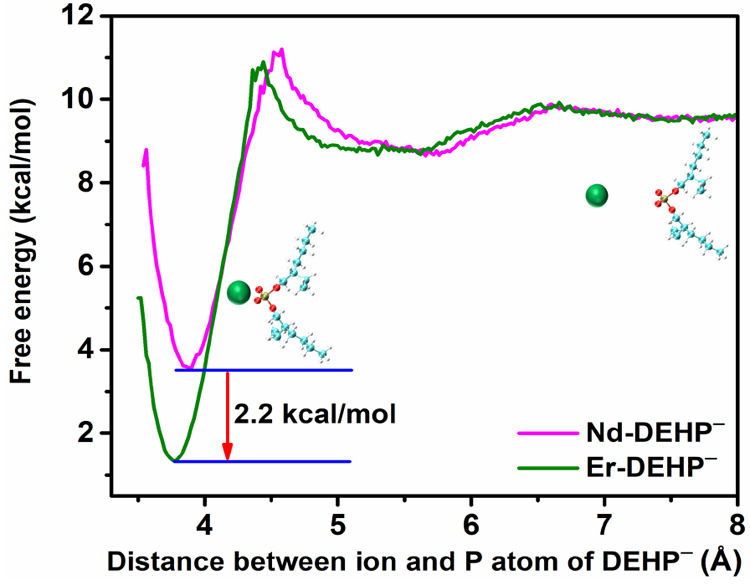
MD simulations of the potential of mean force (PMF or free energy profile) between a single Ln(III) ion and a single DEHP– in bulk water, where Ln(III) is either Er(III) or Nd(III). The deeper minimum and slightly smaller ion to P distance for Er(III) reveal a stronger interaction with Er(III) than with Nd(III). The molecular cartoon illustrates Ln(III) in green at given distances from DEHP– (cyan balls represent carbon, red oxygen, white hydrogen, and bronze phosphorus). See SI Section 2 for MD methods.
The different kinetics of relaxation of the surface tension shown in Figure 2 for light and heavy lanthanides is also likely due to a difference in the bulk complexes. One form of this bulk complexation is illustrated in Figure 6, which shows an MD simulation of the formation of micelles of DEHP– and Ln ions. These micelles have a roughly 3:1 ratio of DEHP–:Er(III) with the Ln ions situated on the outer surface of the micelle. Micelles were also observed in MD simulations for complexes with Nd(III) (not shown). The slower kinetics of heavier lanthanides, which maintains the surface tension of a nearly pure water surface for some time, suggests that bulk complexes of heavy lanthanides are more resistant to surface adsorption. Large complexes such as micelles were not observed at the surface by X-ray reflectivity, which indicates that if present in the bulk solution they would have to disintegrate into smaller complexes upon adsorption to the surface. Therefore, large bulk complexes of heavier lanthanides which are more strongly bound than those of lighter lanthanides would have slower adsorption kinetics. Further research will be required to establish the nature of the bulk aqueous ion–extractant complexes formed by different lanthanides and the mechanism of their adsorption to the solution surface.
Figure 6.

MD simulation of bulk water (without an interface) that illustrates a selection of differently sized micelles formed spontaneously in a bulk aqueous solution of DEHP– represented as a stick structure and Er(III) ions represented by green dots (cyan sticks represent carbon, red oxygen, white hydrogen, and bronze phosphorus, and the water is hidden). The three micelles shown contain 9 DEHP–:3 Er(III), 12 DEHP–:4 Er(III), and 16 DEHP–:5 Er(III). See SI Section 3 for MD methods.
3.5. Ln Ion Adsorption to Water-Insoluble DHDP
If Er(III) has a stronger interaction with DEHP– than does Nd(III), then it might be expected that Er ions would also dominate the interfacial adsorption of (H)DEHP solutions, though this is not observed. We suggested above that the preferential adsorption of light lanthanides is the result of the stronger complexation of heavier Ln ions with (H)DEHP in the bulk aqueous phase. Here, we test this idea by eliminating the bulk complexation and measuring the competitive binding of Nd and Er ions to an insoluble monolayer of dihexadecyl phosphoric acid (DHDP in Chart 1) at the liquid–vapor interface. DHDP has the same phosphoric acid headgroup as HDEHP but longer unbranched hydrocarbon tailgroups, which make it insoluble in the aqueous phase and, therefore, confine it to the interface. The initial ratio of ions in bulk aqueous solution was 1:1 (Nd:Er) at a concentration of 10 μM and a pH of 2.5. The measurement shown in Figure 7 illustrates the temporal evolution of ion adsorption to the DHDP monolayer. The first XFNTR measurement, taken 30 min after spreading the monolayer, illustrates a similar adsorption of both ions to the DHDP monolayer, but soon after, Er ion adsorption dominates the interface. A related observation has been reported of preferential adsorption of Er over Nd to an insoluble octadecylphosphonic acid monolayer supported on the surface of an aqueous electrolyte solution.29 Here, we have seen that when the phosphoric acid headgroups of water-insoluble DHDP are confined to the liquid–vapor interface, Er ions are preferentially adsorbed, but when the extractant is water-soluble HDEHP, then Nd ions were preferentially adsorbed to the liquid–vapor interface.
Figure 7.

Interfacial density of Er(III) and Nd(III) at the surface of pH 2.5 aqueous solution supporting an insoluble monolayer of DHDP. These results from XFNTR measurements illustrate the preferential binding of Er ions over Nd ions for the phosphoric acid headgroup of DHDP confined to the interface (see Figure S8 for XFNTR data and Table S3 for numerical values).
3.6. Implications for Solvent Extraction of Lanthanides by HDEHP
The extractant HDEHP is commonly used in rare earth processes and preferentially extracts heavy over light lanthanides.8,41 In this process, a multicomponent aqueous solution of lanthanides is placed in contact with an immiscible organic solvent containing HDEHP. It is believed that ions complex with (H)DEHP near the interface as the result of one or both of the following processes: (Path 1 in Figure 1) weakly amphiphilic (H)DEHP adsorbs to the liquid–liquid interface, where it then interacts with ions approaching from the water-side of the interface and transports them into the organic phase,12 or (Path 2 in Figure 1) HDEHP dissolves in the aqueous phase boundary layer where it forms hydrophobic complexes with ions, which diffuse back to the interface and into the organic solvent.15 The consequences of these two paths for the kinetics of solvent extraction have been discussed within the mass transfer with chemical reaction (MTWCR) mechanism, which also dismissed the relevance of a third path that originates deep within the bulk aqueous phase.15
Although experiments at the liquid–vapor interface cannot model all processes involved in solvent extraction at the liquid–liquid interface between aqueous and organic solvents, this study has provided insight into the competitive interactions between lanthanides and the water-soluble extractant HDEHP. Specifically, we have found (1) that heavier lanthanides do not populate the liquid–vapor interface as much as lighter lanthanides in single-Ln HDEHP solutions; (2) that the kinetics of heavier lanthanide adsorption to the interface is slower than that of lighter lanthanides by up to 2 orders of magnitude; and (3) that favorable but not overwhelming preferences in single-Ln HDHEP solutions can lead to an overwhelming competitive advantage for the population of lighter over heavier lanthanides at the aqueous–vapor interface of lanthanide mixtures. Overall, these results show that heavier lanthanides are held back in the bulk aqueous phase in favor of lighter lanthanides populating the aqueous–vapor interface under conditions of both equilibrium adsorption and the approach to equilibrium. To the extent that these features at the liquid–vapor interface hold true for the liquid–liquid interface, each appears to be antagonistic to the intended preferential extraction of heavier lanthanides by HDEHP.
Our results suggest a different role for complexation in the bulk aqueous phase than hypothesized by Path 2 in Figure 1. The primarily hydrophobic ion–extractant complexes shown in the aqueous boundary layer in Figure 1, which are expected to transport ions from the boundary layer into the organic phase, cannot explain our results. Instead, complexation and speciation throughout the aqueous phase, including more hydrophilic complexes, must play an important role in the results presented here. Our studies point to a more significant role for aqueous complexation and speciation in understanding competitive Ln-binding to HDEHP at the liquid–vapor interface and suggest that further studies are required to understand their consequences for solvent extraction at the liquid–liquid interface.
4. Conclusion
Measurements of the liquid–vapor interface of aqueous solutions containing a water-soluble extractant, HDEHP, and trivalent lanthanide ions demonstrated the preferential adsorption of light over heavy lanthanides for a solution pH of 2.0, 3.0, and 4.5. Surface tension measurements revealed a sequential variation along the lanthanide series, as well as slower kinetics of adsorption for heavier lanthanides. X-ray reflectivity and X-ray fluorescence near total reflection measurements directly probed the interfacial adsorption of a light lanthanide ion, Nd(III), and a heavy lanthanide ion, Er(III), including element-specific measurements of the interfacial density of these ions. These measurements demonstrated the preferential adsorption of Nd over Er ions at the surface of aqueous solutions containing single Ln ionic components but also revealed the nearly exclusive presence of Nd at the surface under conditions of competitive adsorption in an aqueous solution containing both types of ions. Our hypothesis that light lanthanides form ion–extractant complexes that are more hydrophobic than those formed by heavy lanthanides explains the observed differences in adsorption of light and heavy lanthanide ions to the surface of aqueous solutions of (H)DEHP.
In contrast to these measurements with a soluble organophosphoric acid extractant, HDEHP, measurements of interfacial adsorption to a monolayer of a water-insoluble organophosphoric acid extractant, DHDP, which contains the same headgroup but is confined to the interface, demonstrated the inverse preferential adsorption, that is, a preferential adsorption of Er over Nd. This exhibits the same preference for heavy over light lanthanides that is utilized by liquid–liquid extraction of these elements by HDEHP. Our results suggest that the presence of water-soluble extractant HDEHP will bias the extraction toward heavier lanthanides when it is located at the aqueous–organic interface, but once HDEHP is solvated in the aqueous solution, it becomes antagonistic to the preferential extraction of heavy over light lanthanides. The effects investigated will likely reduce the separation factor between heavy and light lanthanides, thereby leaving excess heavy lanthanide in the aqueous raffinate at the end of the extraction process and complicating the environmental impact of the extraction. Comparative studies at the liquid–liquid interface will be necessary to confirm this suggestion when aqueous and organic phases are in equilibrium. This work also points to an unappreciated role for ion–extractant complexation in the bulk aqueous phase in the context of solvent extraction. Future work is required to further explore the chemical speciation and coordination chemistry of Ln with HDEHP in the bulk aqueous phase and at the interface. Our results clarify the role of the bulk aqueous phase and possible advantages of extractants that interact with ions only at the interface (Path 1 in Figure 1) during solvent extraction. These results may have broader applicability in chemical separations because solvent extraction of solutes from an aqueous phase to an organic phase is a separations technique widely used in chemistry, not just for the separation of rare earth elements, and extractants with some solubility in water are not uncommon.50
Acknowledgments
This research is performed using funding received from the DOE Office of Nuclear Energy’s Nuclear Energy University Program under Award DE-NE0008779 to M.L.S., A.V.G., and M.A.B. This material is also based upon work supported by the U.S. Department of Energy, Office of Science, Office of Basic Energy Sciences Separations Program under Award DE-SC0018200 to M.L.S. and I.B. NSF’s ChemMatCARS Sector 15 is funded by the Divisions of Chemistry (CHE) and Materials Research (DMR), National Science Foundation, under Grant NSF/CHE-1834750. Use of the Advanced Photon Source, an Office of Science User Facility operated for the U.S. Department of Energy (DOE) Office of Science by Argonne National Laboratory, was supported by the U.S. DOE under Contract DE-AC02-06CH11357. We thank Frederick Richard for assistance in measuring the X-ray data from pH 2.0 samples.
Glossary
Abbreviations
- HDEHP
bis(2-ethylhexyl) phosphoric acid
- DHDP
dihexadecyl phosphoric acid
- XFNTR
X-ray fluorescence near total reflection
Supporting Information Available
The Supporting Information is available free of charge at https://pubs.acs.org/doi/10.1021/acscentsci.1c00960.
Experimental details, materials, solution preparation; experimental methodology, surface tension (including equilibrium values and CAC measurements), X-ray instrumentation and Langmuir trough, X-ray reflectivity (including zero-roughness profiles), XFNTR (including spectral analysis, calibration measurements, interfacial density values, time-dependent data); and MD simulation methods (PDF)
Author Present Address
# Z.L.: Center for Functional Nanomaterials, Brookhaven National Laboratory, Upton, NY 11973, U.S.A
Author Contributions
The manuscript was written through contributions of all authors. All authors have given approval to the final version of the manuscript.
The authors declare no competing financial interest.
Supplementary Material
References
- Tasker P. A.; Plieger P. G.; West L. C.. Metal Complexes for Hydrometallurgy and Extraction. In Comprehensive Coordination Chemistry II: From Biology to Nanotechnology; McCleverty J. A., Meyer T. J., Eds.; Elsevier: Oxford, 2004; Vol. 9, pp 759–808. [Google Scholar]
- Huang X.; Dong J.; Wang L.; Feng Z.; Xue Q.; Meng X. Selective recovery of rare earth elements from ion-adsorption rare earth element ores by stepwise extraction with HEH(EHP) and HDEHP. Green Chem. 2017, 19, 1345–1352. 10.1039/C6GC03388A. [DOI] [Google Scholar]
- Cheisson T.; Schelter E. J. Rare earth elements: Mendeleev’s bane, modern marvels. Science 2019, 363, 489–493. 10.1126/science.aau7628. [DOI] [PubMed] [Google Scholar]
- Martinez-Gomez N. C.; Vu H. N.; Skovran E. Lanthanide chemistry: from coordination in chemical complexes shaping our technology to coordination in enzymes shaping bacterial metabolism. Inorg. Chem. 2016, 55, 10083–10089. 10.1021/acs.inorgchem.6b00919. [DOI] [PubMed] [Google Scholar]
- Bauer D.; Diamond D.; Li J.; McKittrick M.; Sandalow D.; Telleen P.. Critical Minerals Strategy; U.S. Department of Energy, 2011; pp 1–189. [Google Scholar]
- Peppard D. F.; Mason G. W.; Maier J. L.; Driscoll W. J. Fractional extraction of the lanthanides as their di-alkyl orthophosphates. J. Inorg. Nucl. Chem. 1957, 4 (5), 334–343. 10.1016/0022-1902(57)80016-5. [DOI] [Google Scholar]
- Sato T. Liquid-Liquid Extraction of Rare-Earth Elements from Aqueous Acid Solutions by Acid Organophosphorus Compounds. Hydrometallurgy 1989, 22, 121–140. 10.1016/0304-386X(89)90045-5. [DOI] [Google Scholar]
- Xie F.; Zhang T. A.; Dreisinger D.; Doyle F. A critical review on solvent extraction of rare earths from aqueous solutions. Miner. Eng. 2014, 56, 10–28. 10.1016/j.mineng.2013.10.021. [DOI] [Google Scholar]
- Huang X. W.; Long Z. Q.; Wang L. S. Technology development for rare earth cleaner hydrometallurgy. Rare Met. 2015, 34, 215–222. 10.1007/s12598-015-0473-x. [DOI] [Google Scholar]
- Watarai H.; Freiser H. Role of the Interface in the Extraction Kinetics of Zinc and Nickel Ions with Alkyl-Substituted Dithizones. J. Am. Chem. Soc. 1983, 105, 189–190. 10.1021/ja00340a007. [DOI] [Google Scholar]
- Gaonkar A. G.; Neuman R. D. Interfacial activity, extractant selectivity, and reversed micellization in hydrometallurgical liquid-liquid-extraction systems. J. Colloid Interface Sci. 1987, 119 (1), 251–261. 10.1016/0021-9797(87)90264-5. [DOI] [Google Scholar]
- Szymanowski J. Kinetics and interfacial phenomena. Solvent Extr. Ion Exch. 2000, 18, 729–751. 10.1080/07366290008934705. [DOI] [Google Scholar]
- Testard F.; Berthon L.; Zemb T. Liquid-liquid extraction: An adsorption isotherm at divided interface?. C. R. Chim. 2007, 10, 1034–1041. 10.1016/j.crci.2007.04.014. [DOI] [Google Scholar]
- Prochaska K. Interfacial activity of metal ion extractant. Adv. Colloid Interface Sci. 2002, 95 (1), 51–72. 10.1016/S0001-8686(00)00084-1. [DOI] [PubMed] [Google Scholar]
- Hughes M. A.; Rod V. A general model to account for the liquid/liquid kinetics of extraction of metals by organic acids. Faraday Discuss. Chem. Soc. 1984, 77, 75–84. 10.1039/dc9847700075. [DOI] [Google Scholar]
- Drelsinger D. B.; Cooper W. C. The kinetics of cobalt and nickel extraction using HEHEHP. Solvent Extr. Ion Exch. 1986, 4 (2), 317–344. 10.1080/07366298608917869. [DOI] [Google Scholar]
- Dreisinger D. B.; Cooper W. C. The kinetics of zinc, cobalt, and nickel extraction in the D2EHPA-heptane-HClO4 system usig the rotating diffusion cell technique. Solvent Extr. Ion Exch. 1989, 7 (2), 335–360. 10.1080/07360298908962312. [DOI] [Google Scholar]
- Honaker C. B.; Freiser H. Kinetics of Extraction of Zinc Dithizonate. J. Phys. Chem. 1962, 66 (1), 127–130. 10.1021/j100807a027. [DOI] [Google Scholar]
- Bu W.; Schlossman M. L.. X-ray Studies of Liquid Interfaces in Model Solvent Extraction Systems. In Ion Exchange and Solvent Extraction: Vol. 23 Changing the Landscape in Solvent Extraction; Moyer B. A., Ed.; CRC Press, Taylor & Francis Group: Boca Raton, FL, 2019; pp 115–146. [Google Scholar]
- Bu W.; Hou B.; Mihaylov M.; Kuzmenko I.; Lin B.; Meron M.; Soderholm L.; Luo G.; Schlossman M. L. X-ray fluorescence from a model liquid/liquid solvent extraction system. J. Appl. Phys. 2011, 110, 102214. 10.1063/1.3661983. [DOI] [Google Scholar]
- Bu W.; Yu H.; Luo G.; Bera M. K.; Hou B.; Schuman A. W.; Lin B.; Meron M.; Kuzmenko I.; Antonio M. R.; Soderholm L.; Schlossman M. L. Observation of a rare earth ion-extractant complex arrested at the oil-water interface during solvent extraction. J. Phys. Chem. B 2014, 118, 10662–10674. 10.1021/jp505661e. [DOI] [PubMed] [Google Scholar]
- Liang Z.; Bu W.; Schweighofer K. J.; Walwark D. J. Jr.; Harvey J. S.; Hanlon G. R.; Amoanu D.; Erol C.; Benjamin I.; Schlossman M. L. A nanoscale view of assisted ion transport across the liquid-liquid interface. Proc. Natl. Acad. Sci. U. S. A. 2019, 116, 18227–18232. 10.1073/pnas.1701389115. [DOI] [PMC free article] [PubMed] [Google Scholar]
- Scoppola E.; Watkins E.; Destri G. L.; Porcar L.; Campbell R. A.; Konovalov O.; Fragneto G.; Diat O. Structure of a liquid/liquid interface during solvent extraction combining X-ray and neutron reflectivity measurements. Phys. Chem. Chem. Phys. 2015, 17, 15093–15097. 10.1039/C5CP01809A. [DOI] [PubMed] [Google Scholar]
- Scoppola E.; Watkins E. B.; Campbell R. A.; Konovalov O.; Luc Girard J.-F. D.; Ferru G.; Fragneto G.; Diat O. Solvent extraction: Structure of the liquid–liquid interface containing a diamide ligand. Angew. Chem. 2016, 128, 9472–9476. 10.1002/ange.201603395. [DOI] [PubMed] [Google Scholar]
- Chowdhury A. U.; Lin L.; Doughty B. Hydrogen-Bond-Driven Chemical Separations: Elucidating the Interfacial Steps of Self-Assembly in Solvent Extraction. ACS Appl. Mater. Interfaces 2020, 12 (28), 32119–32130. 10.1021/acsami.0c06176. [DOI] [PubMed] [Google Scholar]
- Wang W. J.; Park R. Y.; Meyer D. H.; Travesset A.; Vaknin D. Ionic Specificity in pH Regulated Charged Interfaces: Fe3+ versus La3+. Langmuir 2011, 27 (19), 11917–11924. 10.1021/la201880g. [DOI] [PubMed] [Google Scholar]
- Sung W.; Vaknin D.; Kim D. Different Adsorption Behavior of Rare Earth and Metallic Ion Complexes on Langmuir Monolayers Probed by Sum-Frequency Generation Spectroscopy. J. Opt. Soc. Korea 2013, 17, 10–15. 10.3807/JOSK.2013.17.1.010. [DOI] [Google Scholar]
- Miller M.; Chu M.; Lin B.; Bu W.; Dutta P. Atomic Number Dependent “Structural Transitions” in Ordered Lanthanide Monolayers: Role of the Hydration Shell. Langmuir 2017, 33 (6), 1412–1418. 10.1021/acs.langmuir.6b04609. [DOI] [PubMed] [Google Scholar]
- Miller M.; Liang Y.; Li H.; Chu M.; Yoo S.; Bu W.; Olvera de la Cruz M.; Dutta P. Electrostatic Origin of Element Selectivity during Rare Earth Adsorption. Phys. Rev. Lett. 2019, 122 (5), 058001. 10.1103/PhysRevLett.122.058001. [DOI] [PubMed] [Google Scholar]
- Rock W.; Qiao B.; Zhou T.; Clark A. E.; Uysal A. Heavy Anionic Complex Creates a Unique Water Structure at a Soft Charged Interface. J. Phys. Chem. C 2018, 122 (51), 29228–29236. 10.1021/acs.jpcc.8b08419. [DOI] [Google Scholar]
- Uysal A.; Rock W.; Qiao B.; Bu W.; Lin B. Two-Step Adsorption of PtCl62– Complexes at a Charged Langmuir Monolayer: Role of Hydration and Ion Correlations. J. Phys. Chem. C 2017, 121 (45), 25377–25383. 10.1021/acs.jpcc.7b09350. [DOI] [Google Scholar]
- Neal J. F.; Zhao W.; Grooms A. J.; Smeltzer M. A.; Shook B. M.; Flood A. H.; Allen H. C. Interfacial Supramolecular Structures of Amphiphilic Receptors Drive Aqueous Phosphate Recognition. J. Am. Chem. Soc. 2019, 141 (19), 7876–7886. 10.1021/jacs.9b02148. [DOI] [PubMed] [Google Scholar]
- Nayak S.; Lovering K.; Bu W.; Uysal A. Anions Enhance Rare Earth Adsorption at Negatively Charged Surfaces. J. Phys. Chem. Lett. 2020, 11 (11), 4436–4442. 10.1021/acs.jpclett.0c01091. [DOI] [PubMed] [Google Scholar]
- Lovering K.; Nayak S.; Bu W.; Uysal A. The Role of Specific Ion Effects in Ion Transport: The Case of Nitrate and Thiocyanate. J. Phys. Chem. C 2020, 124 (1), 573–581. 10.1021/acs.jpcc.9b09288. [DOI] [Google Scholar]
- Grooms A. J.; Neal J. F.; Ng K. C.; Zhao W.; Flood A. H.; Allen H. C. Thermodynamic Signatures of the Origin of Anti-Hofmeister Selectivity for Phosphate at Aqueous Interfaces. J. Phys. Chem. A 2020, 124 (27), 5621–5630. 10.1021/acs.jpca.0c02515. [DOI] [PubMed] [Google Scholar]
- Neal J. F.; Saha A.; Zerkle M. M.; Zhao W.; Rogers M. M.; Flood A. H.; Allen H. C. Molecular Recognition and Hydration Energy Mismatch Combine To Inform Ion Binding Selectivity at Aqueous Interfaces. J. Phys. Chem. A 2020, 124 (49), 10171–10180. 10.1021/acs.jpca.0c09568. [DOI] [PubMed] [Google Scholar]
- Nayak S.; Kumal R. R.; Liu Z.; Qiao B.; Clark A. E.; Uysal A. Origins of Clustering of Metalate–Extractant Complexes in Liquid–Liquid Extraction. ACS Appl. Mater. Interfaces 2021, 13 (20), 24194–24206. 10.1021/acsami.0c23158. [DOI] [PubMed] [Google Scholar]
- Kusaka R.; Watanabe M. The structure of a lanthanide complex at an extractant/water interface studied using heterodyne-detected vibrational sum frequency generation. Phys. Chem. Chem. Phys. 2018, 20 (4), 2809–2813. 10.1039/C7CP06758E. [DOI] [PubMed] [Google Scholar]
- Kusaka R.; Watanabe M. Stoichiometry of Lanthanide–Phosphate Complexes at the Water Surface Studied Using Vibrational Sum Frequency Generation Spectroscopy and DFT Calculations. J. Phys. Chem. B 2021, 125 (24), 6727–6731. 10.1021/acs.jpcb.1c04583. [DOI] [PubMed] [Google Scholar]
- Steytler D. C.; Sargeant D. L.; Welsh G. E.; Robinson B. H.; Heenan R. K. Ammonium Bis(ethylhexyl) Phosphate: A New Surfactant for Microemulsions. Langmuir 1996, 12 (22), 5312–5318. 10.1021/la9605091. [DOI] [Google Scholar]
- Nilsson M.; Nash K. L. A Review of the Development and Operational Characteristics of the TALSPEAK Process. Solvent Extr. Ion Exch. 2007, 25, 665–701. 10.1080/07366290701634636. [DOI] [Google Scholar]
- Launiere C. A.; Gelis A. V. High Precision Droplet-Based Microfluidic Determination of Americium(III) and Lanthanide(III) Solvent Extraction Separation Kinetics. Ind. Eng. Chem. Res. 2016, 55 (7), 2272–2276. 10.1021/acs.iecr.5b04691. [DOI] [Google Scholar]
- Nichols K. P.; Pompano R. R.; Li L.; Gelis A. V.; Ismagilov R. F. Toward Mechanistic Understanding of Nuclear Reprocessing Chemistries by Quantifying Lanthanide Solvent Extraction Kinetics via Microfluidics with Constant Interfacial Area and Rapid Mixing. J. Am. Chem. Soc. 2011, 133 (39), 15721–15729. 10.1021/ja206020u. [DOI] [PubMed] [Google Scholar]
- Pershan P. S.; Schlossman M. L.. Liquid Surfaces and Interfaces: Synchrotron X-ray Methods; Cambridge University Press: Cambridge, 2012. [Google Scholar]
- Schlossman M. L.; Synal D.; Guan Y.; Meron M.; Shea-McCarthy G.; Huang Z.; Acero A.; Williams S. M.; Rice S. A.; Viccaro P. J. A synchrotron x-ray liquid surface spectrometer. Rev. Sci. Instrum. 1997, 68, 4372–4384. 10.1063/1.1148399. [DOI] [Google Scholar]
- Lin B.; Meron M.; Gebhardt J.; Graber T.; Schlossman M. L.; Viccaro P. J. The liquid surface/interface spectrometer at ChemMatCARS synchrotron facility at the Advanced Photon Source. Phys. B 2003, 336, 75–80. 10.1016/S0921-4526(03)00272-2. [DOI] [Google Scholar]
- Bevington P. R.; Robinson D. K.. Data Reduction and Error Analysis for the Physical Sciences, 3rd ed.; McGraw Hill: New York, 2003; Chapter 11. [Google Scholar]
- Welbourn R. J. L.; Lee S. Y.; Gutfreund P.; Hughes A.; Zarbakhsh A.; Clarke S. M. Neutron Reflection Study of the Adsorption of the Phosphate Surfactant NaDEHP onto Alumina from Water. Langmuir 2015, 31, 3377–3384. 10.1021/la504837s. [DOI] [PubMed] [Google Scholar]
- Marcus Y. Ionic Radii in Aqueous Solutions. Chem. Rev. 1988, 88, 1475–1498. 10.1021/cr00090a003. [DOI] [Google Scholar]
- Sekine T.; Hasegawa Y.. Solvent Extraction Chemistry: Fundamentals and Applications; M. Dekker: New York, 1977. [Google Scholar]
Associated Data
This section collects any data citations, data availability statements, or supplementary materials included in this article.