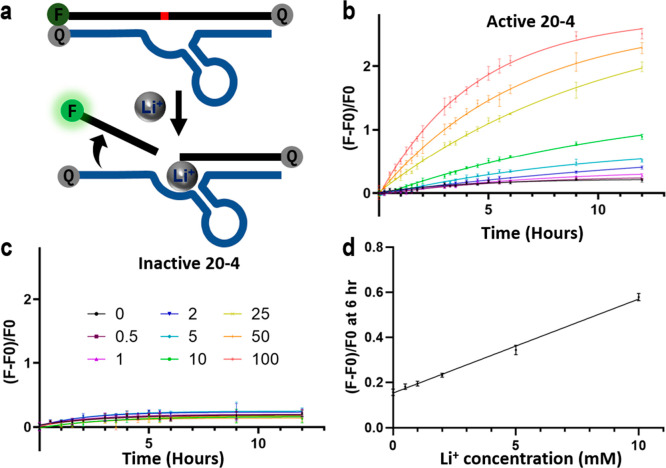
Figure 2.
In vitro performance of the trans-20-4 Li+ fluorescence sensor. (a) Design of the Li+ DNAzyme catalytic beacon. (b, c) Fluorescence increase of (b) the active sensor and (c) the inactive sensor over time at different Li+ concentrations under a molecular crowding environment. Data are plotted as the mean ± SD n = 3 for each group. (d) The linear response range of normalized fluorescence intensity from the active sensor at the 6-h time point corresponding to the Li+ concentration under a molecular crowding environment. Data are shown as mean ± SD n = 3 for each group.

