FIGURE 1.

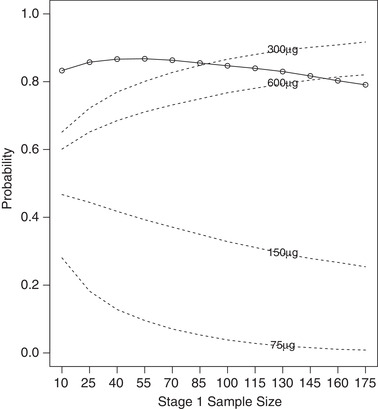
Probability of rejection of at least one elementary hypothesis (○; solid line), and selection probabilities (dashed lines) for stage 1 sample sizes in range 10–175 per group

Probability of rejection of at least one elementary hypothesis (○; solid line), and selection probabilities (dashed lines) for stage 1 sample sizes in range 10–175 per group