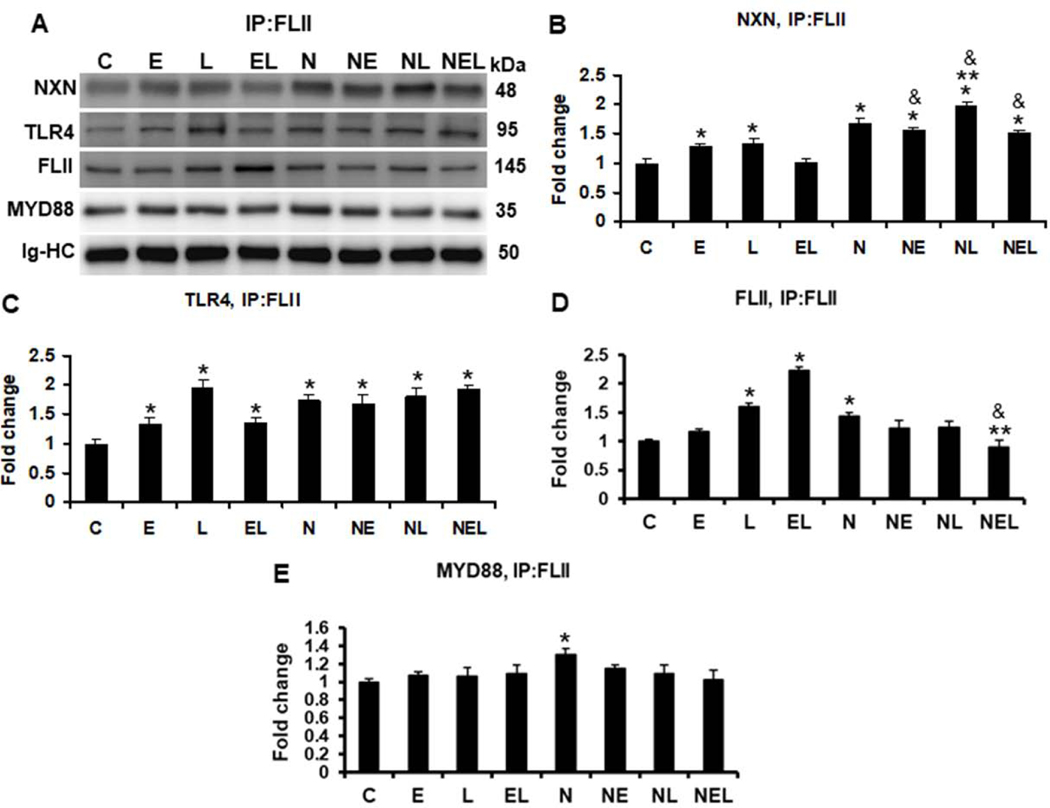
Fig. 5. IP of FLII and evaluation of ethanol effect on FLII/NXN/MYD88 complex in vitro.
(A) Western blot analyses were used to quantify MYD88, NXN, and TLR4 proteins co-immunoprecipitated with FLII protein. Densitometric quantification of (B) NXN, (C) TLR4, (D) FLII, and (E) MYD88 protein levels. Ethanol and LPS alone increased 1.3 fold NXN/FLII binding ratio but their combination reverted it in untransfected cells. This increment was induced 1.2 fold by LPS in NXN-transfected cells. Ethanol and LPS alone, and their combination increased 1.3, 1.9 and 1.3 fold, respectively, NXN/TLR4 binding ratio in untranfected cells FLII levels were increased more than 1.5 and 2.2 fold by LPS and by ethanol plus LPS, respectively, in untransfected cells but this levels were decreased 38% by ethanol plus LPS in NXN overexpressing cells. MYD88 levels increased 1.3 fold in NXN-transfected vs untransfected controls. Total proteins from co-cultures were used for FLII immunoprecipitation. Immunoglobulin heavy chains (Ig-HC) used for IP (anti-FLII antibody) assay were detected and quantify to normalize all precipitated proteins. Bars values are expressed as fold change compared to controls and represent the mean ±SE. n=6 per group. Statistically different from *C, from **N, and from &the same treatment in untransfected cells; p<0.05. Groups: C, Control; E, Ethanol; L, LPS; and EL, Ethanol plus LPS, were transfected with EV and were called untransfected cells. N, NXN-transfected cells; these cells were also exposed to E, L and EL treatments and were identified as: NE, NL and NEL, respectively.

