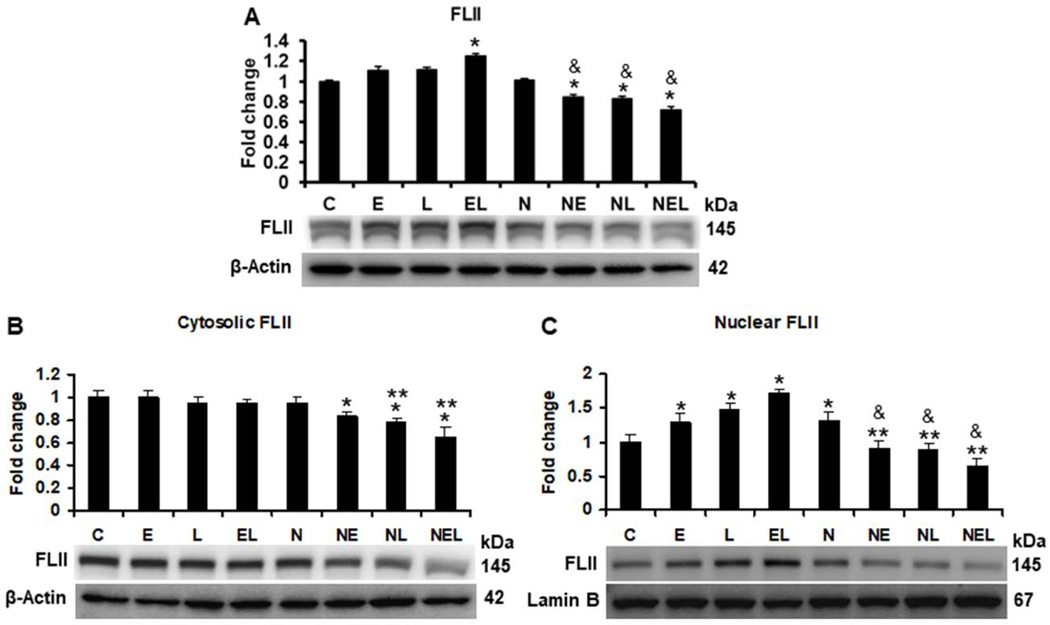
Fig. 6. Ethanol effect on FLII protein status in vitro.
(A) Total, (B) Cytosolic, and (C) Nuclear content of FLII. Co-cultures transfected either with empty (EV) or with NXN expression vector were treated with ethanol and/or LPS for 48 h. While total and cytosolic protein levels were normalized to the house-keeping β-Actin, that of nuclear protein levels were normalized to Lamin B levels. Bars values are expressed as fold change compared to controls and represent the mean ±SE. n=6 per group. Statistically different from *C, from **N, and from &the same treatment in untransfected cells; p<0.05. Groups: C, Control; E, Ethanol; L, LPS; and EL, Ethanol plus LPS, were transfected with EV and were called untransfected cells. N, NXN-transfected cells; these cells were also exposed to E, L and EL treatments and were identified as: NE, NL and NEL, respectively.

