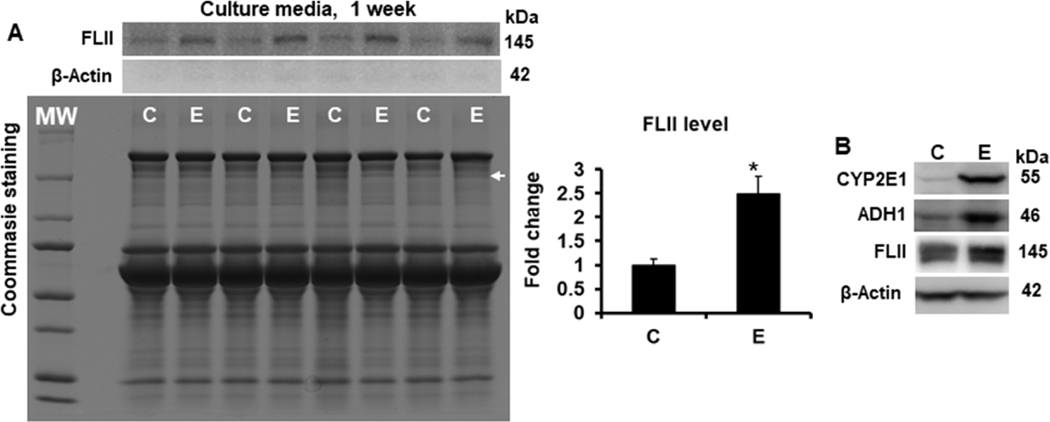
Fig. 8. Effect of ethanol on FLII secretion into cell culture medium after one week of ethanol exposition.
(A) Secretion of FLII into the culture medium. Culture media were collected one week after ethanol exposition and prepared as described in materials and methods section. Protein levels were normalized to Coommasie Blue-stained gels used as loading control. (B) Protein levels of CYP2E1, ADH1 and FLII. Total proteins were extracted from co-cultures after one week of ethanol exposition. To prevent cells death by the prolonged period of starvation time, ethanol was mixed in regular culture medium. Bars values are expressed as fold change compared to controls and represent the mean ±SE. n=6 per group. Statistically different from *C group; p<0.05. White MW letters and arrows on Coommasie Blue-stained gel indicate protein Molecular Weights and FLII size location, respectively. Groups: C, Control; E, Ethanol.

