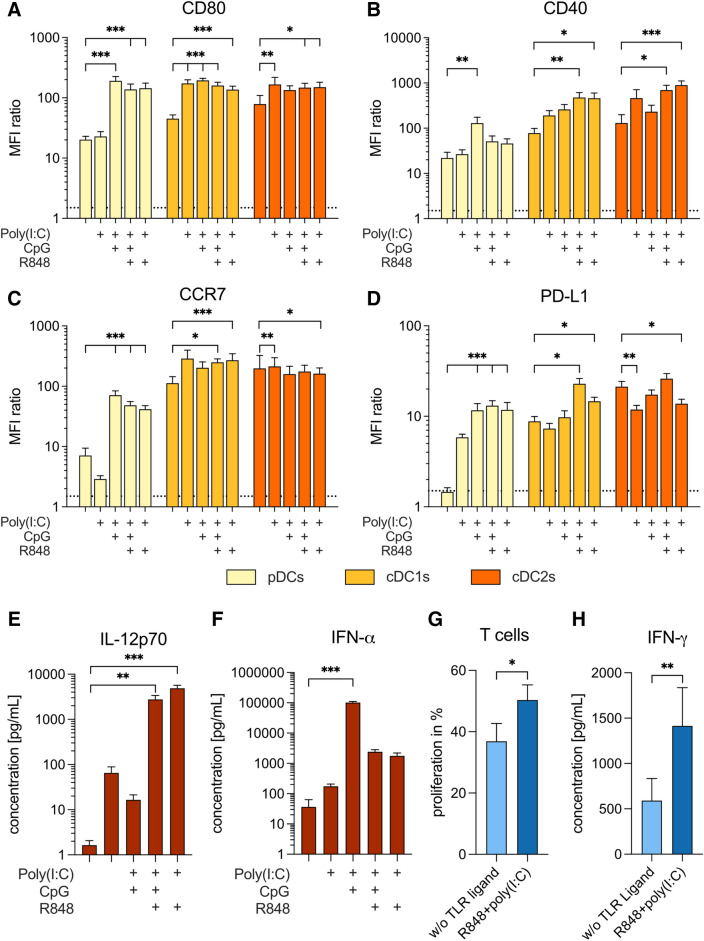
Fig. 2.
Comparison of TLR ligand cocktails for simultaneous activation of all BDC subsets. Expression of CD80 (a), CD40 (b), CCR7 (c), and PD-L1 (d) on BDC subsets, and secretion of IL-12p70 (e) and IFN-α (f) by BDCs in response to activation with different TLR ligand cocktails (n = 6). (g) T-cell proliferation and (h) secretion of IFN-γ by T cells induced by BDCs activated without TLR ligands (light blue) or R848 + poly(I:C) (dark blue) (n = 14–16). Bars represent mean ± SEM. Statistical differences compared to the control without TLR ligand were analyzed by paired one-way ANOVA with Bonferroni's multiple comparison test (a–f) or Wilcoxon matched-pairs signed-rank test (g, h). Only significant differences are shown: *p < 0.05, **p < 0.01, ***p < 0.001

