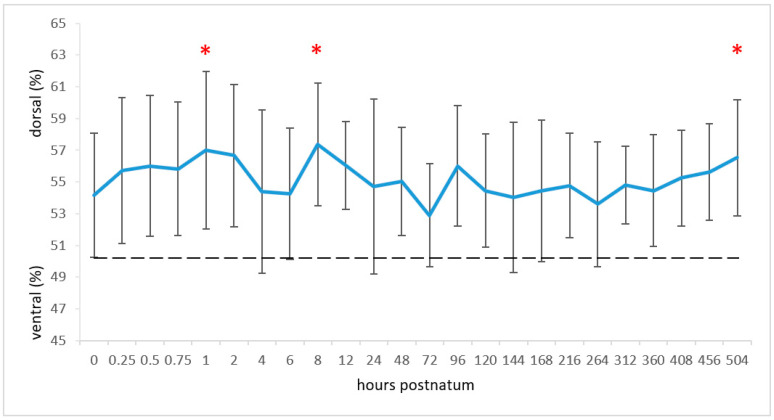
Figure 3.
Means and standard deviations of the centre of ventilation (CoV; blue line) in the ventrodorsal lung diameter and CoV for equal distribution between the ventral and dorsal regions (black dashed line). The measuring times are graphed equidistantly. Values with an asterisk differ from the value at time 0.

