Figure 4.
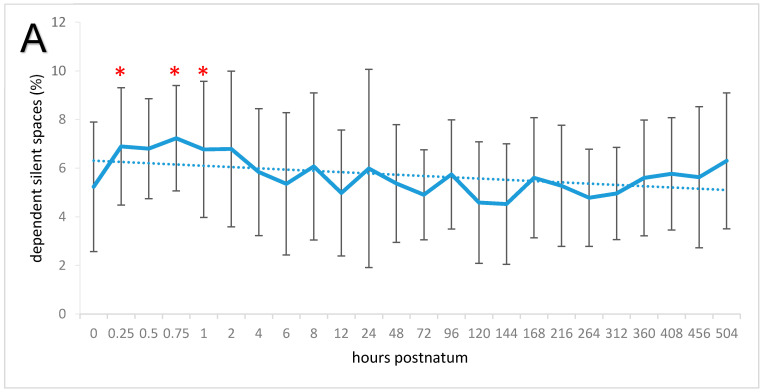
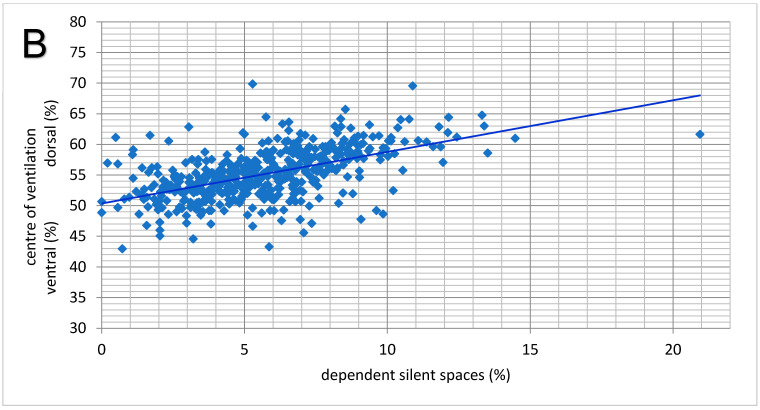
(A) Means and standard deviations of the dependent silent spaces (poorly or nonventilated ventral lung regions; solid line) and trend line (dotted) in 20 neonatal calves. The measuring times are graphed equidistantly. Values with an asterisk differ from the value at time 0. (B) Correlation between percentage values of the ventrodorsal centre of ventilation and the dependent silent spaces (r = 0.55; p < 0.00001).


