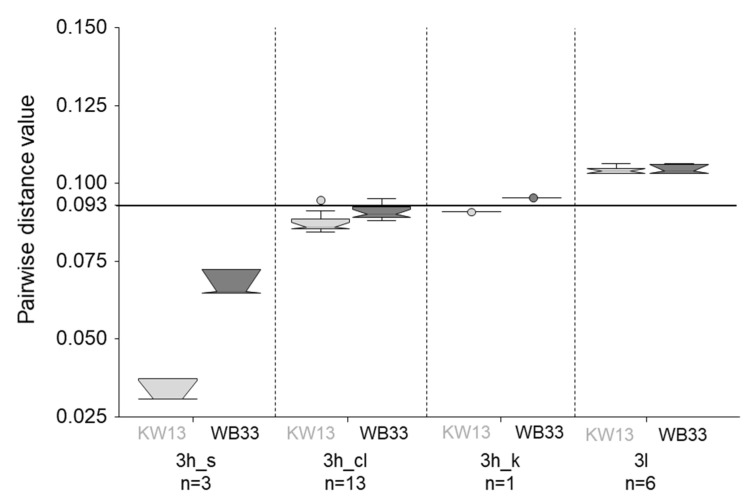
Figure 5.
Boxplot visualization of the pairwise distance values of comparing KW13 (light grey) and WB33 (dark grey) full genomes to all full-length reference sequences of subtypes 3h and 3l. Separate distances were calculated for the three clusters within 3h that relate to the classic 3h genomes (3h_cl) and the formerly proposed subtypes 3s(p) (3h_s) and 3k(p) (3h_k) (Figure 4). The number of available references for each subtype/cluster are indicated below the names. The subtype demarcation cut-off of 0.093 is indicated by a horizontal line. The whiskers extend to 1.5x interquartile range (IQR) from the box edge. Outliers are marked by circles. The notches are constructed using the formula: Median +/− 1.57 × (IQR)/√n.

