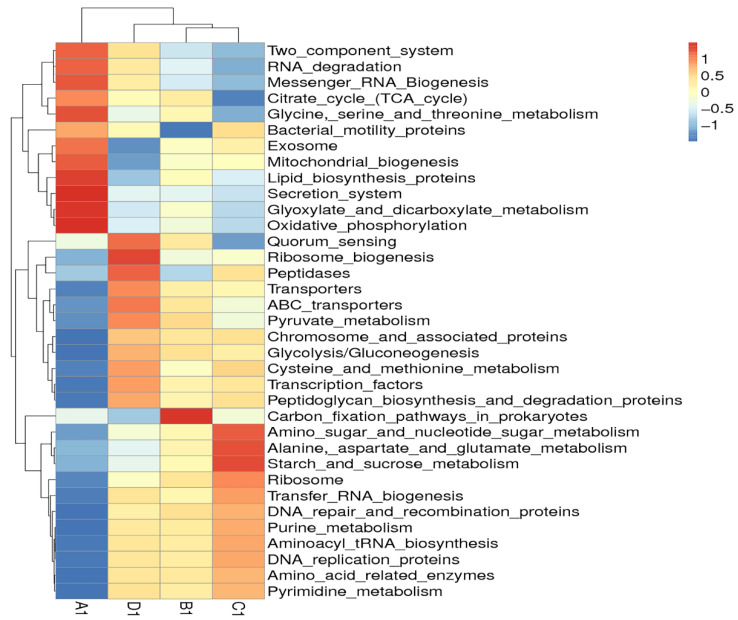
Figure 7.
Hierarchical clustering heatmap of Tax4fun annotated function of bacteria in the jejunal content. Note: The heatmap was constructed at the KEGG level 3 using the relative abundance of bacteria in the jejunal contents from different groups of geese. The red or blue colors for a certain annotated function indicate that the relative abundance of bacteria in this group is greater or lower than the average relative abundance of bacteria across all the groups after normalization, respectively. Group A (as control) was fed a basal diet, the treatment groups (B, C and D) were fed the basal diet supplemented with 250 mg/kg Clostridium butyricum (viable count 3.0 × 10⁶ CFU/g), 250 mg/kg Bacillus subtilis (viable count 2.0 × 10⁷ CFU/g), or the combination of 250 mg/kg Clostridium butyricum plus 250 mg/kg Bacillus subtilis, respectively. n = 6.

