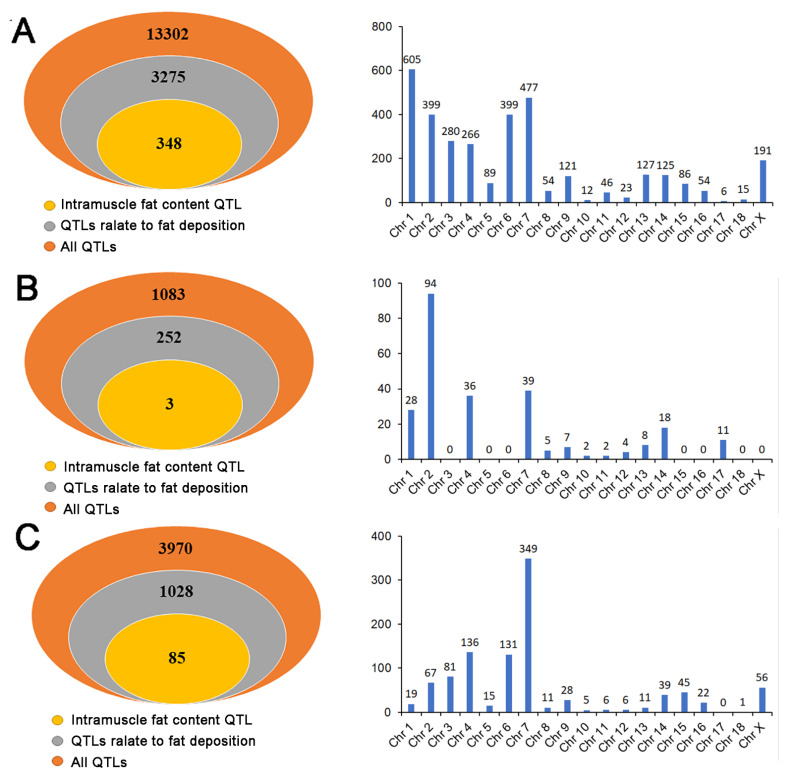
Figure 5.
Quantitative trait locus analysis of DE RNAs. (A) The number distribution of QTLs related to fat deposition, the number of QTLs related to fat deposition, and the chromosome distribution of the QTLs related to fat deposition of the DE lncRNAs. (B) The number distribution of QTLs related to fat deposition, the number of QTLs related to fat deposition, and the chromosome distribution of the QTLs related to fat deposition of the DE miRNAs. (C) The number distribution of QTLs related to fat deposition, the number of QTLs related to fat deposition, and the chromosome distribution of the QTLs related to fat deposition of the DE circRNAs.

