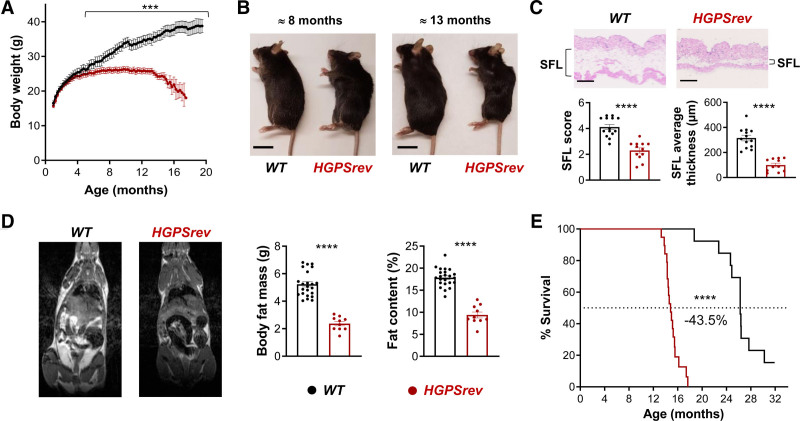
Figure 3.
Progeroid phenotype in LmnaHGPSrev/HGPSrev (HGPSrev) mice with ubiquitous progerin expression. A, Postnatal body weight curves (n=14 WT; n=22 HGPSrev). Differences were analyzed by unpaired multiple t-tests and the Holm-Sidák correction. B, Representative images of ≈8- and ≈13-month-old mice. Scale bar, 2 cm. C, Representative images of hematoxylin-eosin–stained skin from ≈13-month-old mice and the results of subcutaneous fat layer (SFL) score and thickness quantification (see Methods; n=13 or 14 WT; n=11 or 12 HGPSrev). Statistical analysis was performed by 2-tailed t test. Scale bar, 500 µm. D, Representative images of sagittal whole-body cross-sections obtained by magnetic resonance imaging (fat shown in white) and quantification of body fat mass and percentage fat content in ≈13-month-old mice (n=23 WT; n=10 HGPSrev). Differences were analyzed by 2-tailed t test. E, Kaplan-Meier survival curve (n=13 WT; n=22 HGPSrev). Differences were analyzed by the Mantel-Cox test. ***P<0.001; ****P<0.0001. Data are mean±SEM. Each symbol represents 1 animal.

