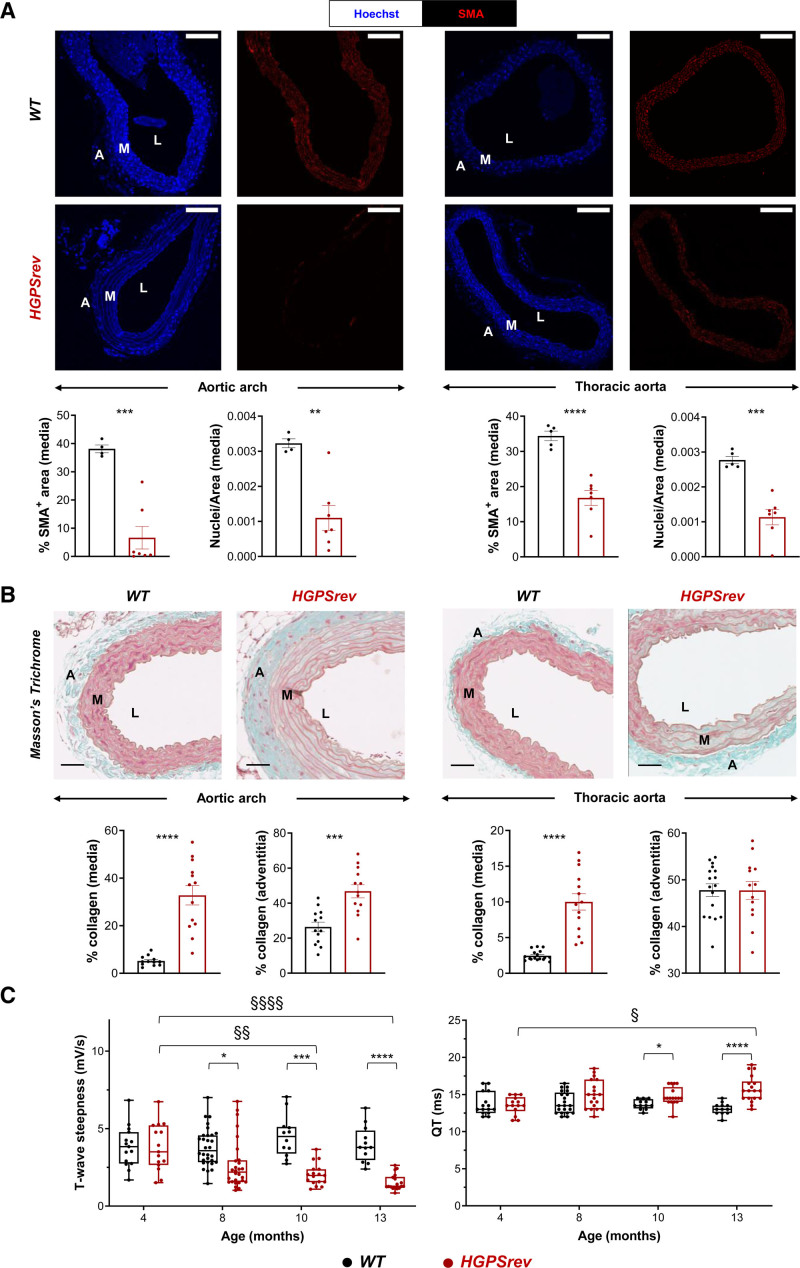
Figure 5.
Cardiovascular abnormalities in ≈13-month-old HGPSrev mice. A, Representative immunofluorescence images of aortic arch (left) and thoracic aorta (right). Specimens were costained with anti–smooth muscle α-actin (SMA) antibody (red) and Hoechst 33342 (blue) to visualize vascular smooth muscle cells (VSMCs) and nuclei, respectively. Graphs show quantification of VSMC content in the media as either the percentage of SMA-positive area or nuclear density (n=4 or 5 WT; n=7 HGPSrev). Scale bar, 150 µm. Data are mean±SEM. Statistical analysis was performed by 2-tailed t test (**P<0.01; ***P<0.001; ****P<0.0001). B, Representative images and quantification of Masson’s trichrome staining to visualize medial and adventitial collagen content in aortic arch (left) and thoracic aorta (right) of ≈13-month-old mice (n=13–17 WT; n=13 or 14 HGPSrev). Scale bar, 50 µm. Data are mean±SEM. Statistical analysis was performed by 2-tailed t test (***P<0.001; ****P<0.0001). C, Longitudinal ECG assessment (n=12–23 WT; n=14–19 HGPSrev). Data are median with interquartile range ± minima and maxima. Differences were analyzed by mixed-effects analysis using the Geisser-Greenhouse correction and Sidák’s multiple comparisons test. Differences over time within each genotype: §P<0.05; §§P<0.01; §§§§P<0.0001. Differences between genotypes at each time point: *P<0.05; ***P<0.001; ****P<0.0001. Each symbol represents 1 animal. A indicates adventitia; M, media; and L, lumen.

