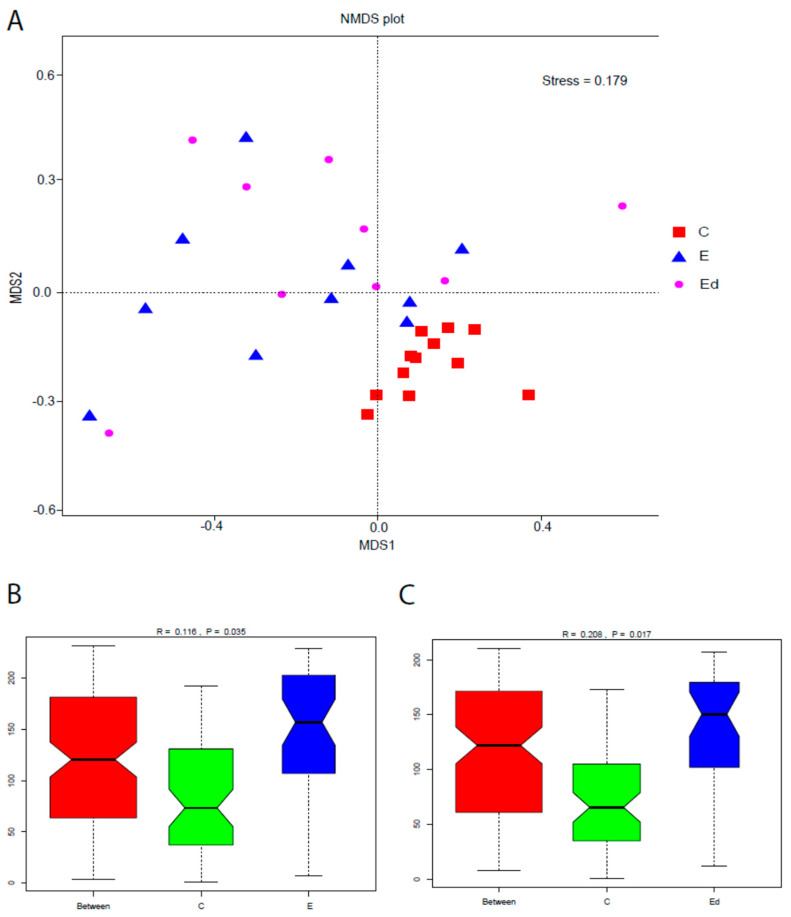
Figure 3.
Beta diversity of the faecal bacterial communities of controls (C), drug-naive epileptic dogs (E) and epileptic dogs after treatment with an AED (Ed). (A) Non-metric Multidimensional Scaling (NMDS) plots show that C and E were are distinct clusters. (B,C) Analysis of similarity (Anosim) evidenced significant differences between C and E dogs and between C and Ed, but not between epileptic dogs before (E) and after treatment (Ed).

