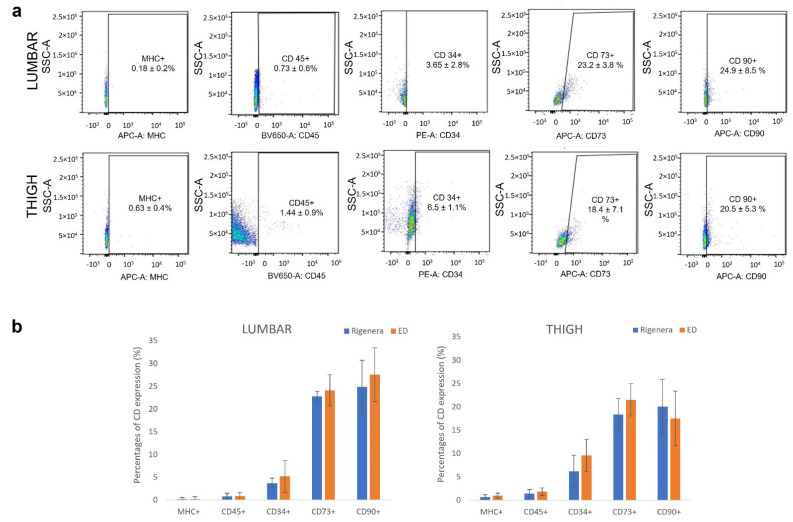
Figure 2.
Immunophenotype analysis. (a) Representative set of dot-plot from one individual from lumbar and thigh region of Rigenera® product. Results show that cultures were negative for MHC class II, less positive for CD45 and CD34, and positive for CD73 and CD90. (b) Percentage of positive cells to CD markers (as average of the samples) after Rigenera® and ED treatment. Results are expressed as average ± SEM of n = 6 samples; no significant statistical differences in the marker expression level were found between Rigenera® and ED treatment.

