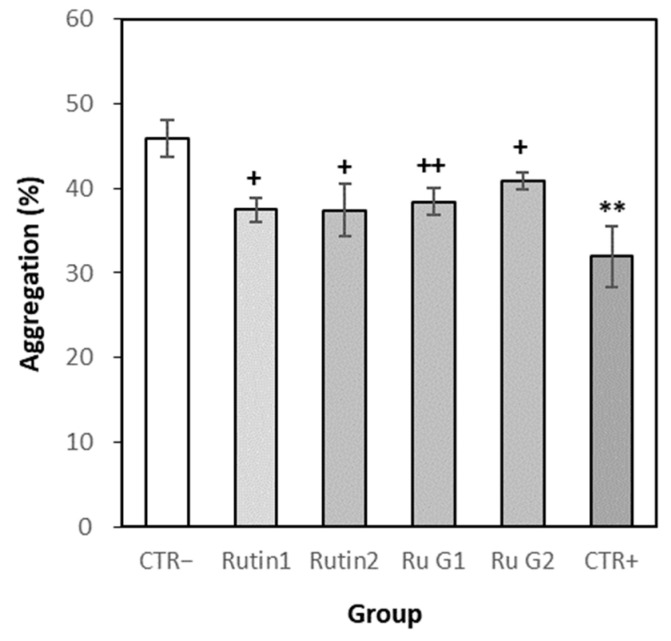
Figure 9.
The aggregation rates of PRP in vivo. Each time point represented the mean ± S.E. (n = 8). CTR−; normal control, CTR+; positive control (aspirin), Ru G; rutin glycoside. Significant differences from the normal control group were determined via Independent t-test (** p < 0.01). Significant differences from the normal control group were determined via Dunnett’s t-test (+ p < 0.05, ++ p < 0.01).

