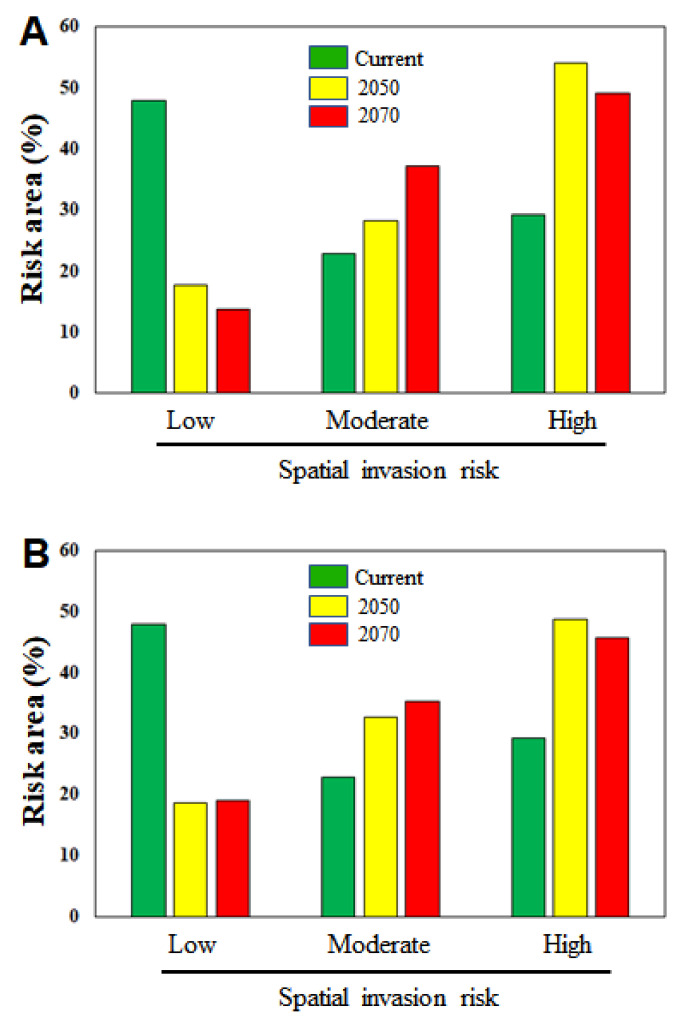
Figure 8.
Estimates of the area assigned to different categories of invasion risk relative to the total area of South Korea. The numbers on the y-axis indicate the percentage area categorized as at low, moderate, or high risk of invasion under current and future environmental conditions. (A) RCP 4.5 and (B) RCP 8.5.

