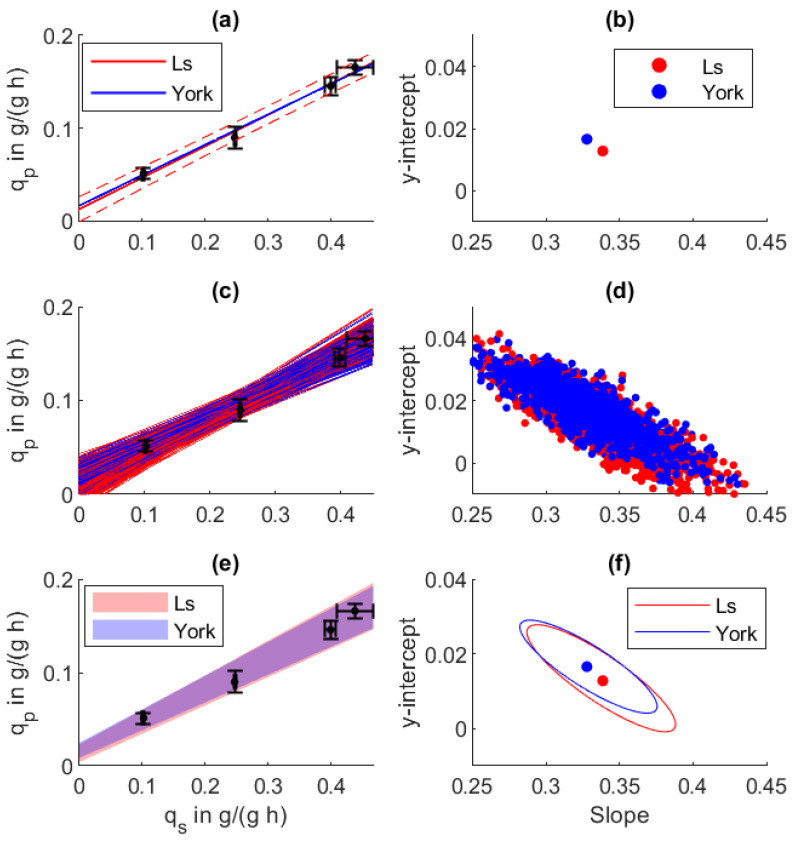
Figure 3.
Regression analysis between biomass-specific substrate uptake and specific production rate in an E. coli fed-batch process. (a) Regression line and (b) regression parameters from normal least squares (LS) and York regression (York). (c,d) One-thousand Monte Carlo regressions based on the uncertainties of the specific rates. (e,f) The obtained 68.3% parameter confidence intervals and resulting prediction confidence.

